29
/es/
es
AIzaSyAYiBZKx7MnpbEhh9jyipgxe19OcubqV5w
April 1, 2024
240800
Singapore
SGP
true
2
1
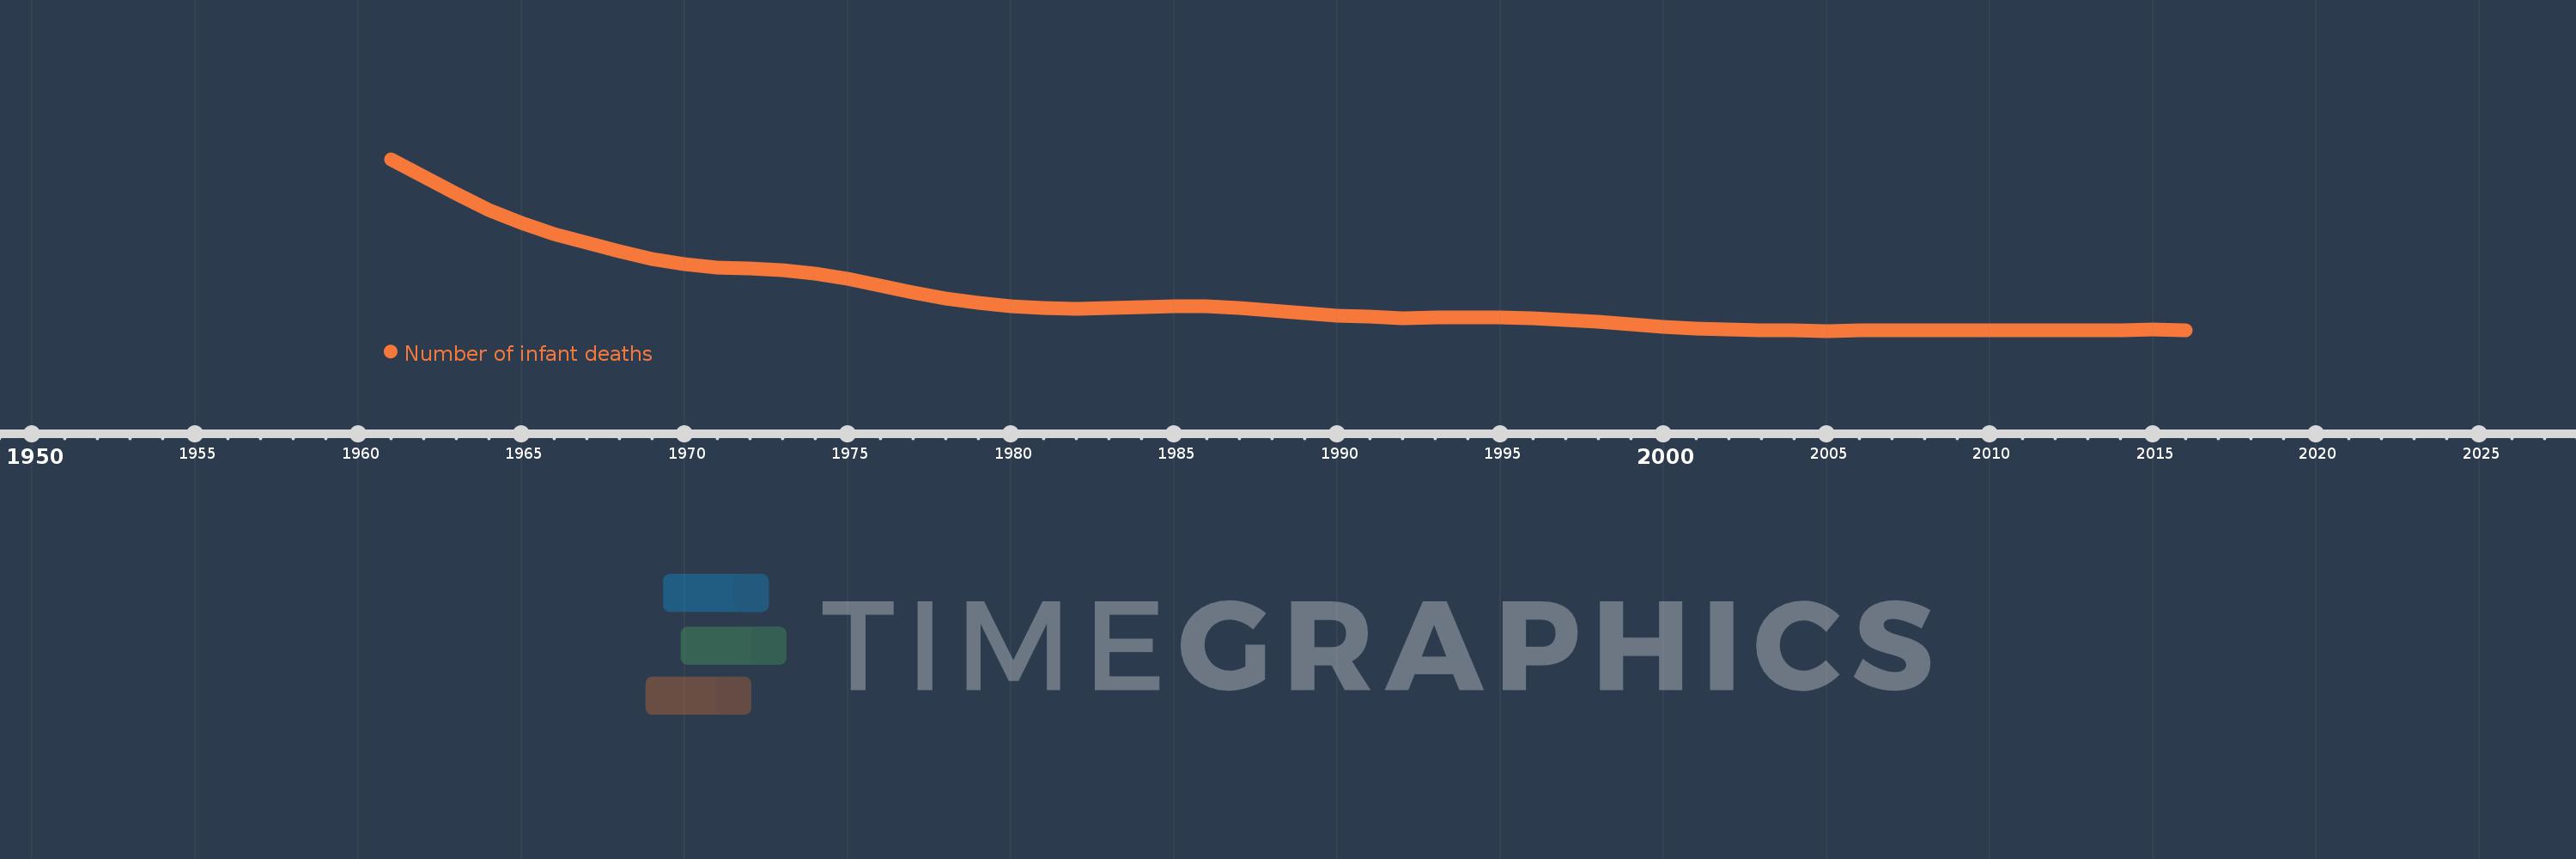
Number of infant deaths
2016,2015,2014,2013,2012,2011,2010,2009,2008,2007,2006,2005,2004,2003,2002,2001,2000,1999,1998,1997,1996,1995,1994,1993,1992,1991,1990,1989,1988,1987,1986,1985,1984,1983,1982,1981,1980,1979,1978,1977,1976,1975,1974,1973,1972,1971,1970,1969,1968,1967,1966,1965,1964,1963,1962,1961
Estas estadísticas en otros países:
AfghanistanAlbaniaAlgeriaAndorraAngolaAntigua and BarbudaArgentinaArmeniaAustraliaAustriaAzerbaijanBahamas, TheBahrainBangladeshBarbadosBelarusBelgiumBelizeBeninBhutanBoliviaBosnia and HerzegovinaBotswanaBrazilBrunei DarussalamBulgariaBurkina FasoBurundiCabo VerdeCambodiaCameroonCanadaCentral African RepublicChadChileChinaColombiaComorosCongo, Dem. Rep.Congo, Rep.Costa RicaCote d'IvoireCroatiaCubaCyprusCzech RepublicDenmarkDjiboutiDominicaDominican RepublicEast Asia & Pacific (excluding high income)EcuadorEgypt, Arab Rep.El SalvadorEquatorial GuineaEritreaEstoniaEthiopiaEurope & Central Asia (excluding high income)FijiFinlandFranceGabonGambia, TheGeorgiaGermanyGhanaGreeceGrenadaGuatemalaGuineaGuinea-BissauGuyanaHaitiHigh incomeHondurasHungaryIcelandIndiaIndonesiaIran, Islamic Rep.IraqIrelandIsraelItalyJamaicaJapanJordanKazakhstanKenyaKiribatiKorea, Dem. People’s Rep.Korea, Rep.KuwaitKyrgyz RepublicLao PDRLatin America & Caribbean (excluding high income)LatviaLebanonLesothoLiberiaLibyaLithuaniaLow & middle incomeLow incomeLower middle incomeLuxembourgMacedonia, FYRMadagascarMalawiMalaysiaMaldivesMaliMaltaMarshall IslandsMauritaniaMauritiusMexicoMicronesia, Fed. Sts.Middle East & North Africa (excluding high income)Middle incomeMoldovaMonacoMongoliaMontenegroMoroccoMozambiqueMyanmarNamibiaNauruNepalNetherlandsNew ZealandNicaraguaNigerNigeriaNorwayOmanPakistanPalauPanamaPapua New GuineaParaguayPeruPhilippinesPolandPortugalQatarRomaniaRussian FederationRwandaSamoaSan MarinoSao Tome and PrincipeSaudi ArabiaSenegalSerbiaSeychellesSierra LeoneSingaporeSlovak RepublicSloveniaSolomon IslandsSomaliaSouth AfricaSouth AsiaSouth SudanSpainSri LankaSt. Kitts and NevisSt. LuciaSt. Vincent and the GrenadinesSub-Saharan Africa (excluding high income)SudanSurinameSwazilandSwedenSwitzerlandSyrian Arab RepublicTajikistanTanzaniaThailandTimor-LesteTogoTongaTrinidad and TobagoTunisiaTurkeyTurkmenistanTuvaluUgandaUkraineUnited Arab EmiratesUnited KingdomUnited StatesUpper middle incomeUruguayUzbekistanVanuatuVenezuela, RBVietnamWest Bank and GazaWorldYemen, Rep.ZambiaZimbabwe línea de tiempo (timeline):
En esta escala de tiempo se presenta un gráfico de 1961 y 2016 de Singapore. Los datos de 1960 están ausentes. El número de observaciones reales por fecha: 56.
Fuente (nombre):
Indicadores del desarrollo mundial
Fuente (organización):
Estimates developed by the UN Inter-agency Group for Child Mortality Estimation (UNICEF, WHO, World Bank, UN DESA Population Division) at www.childmortality.org.
Categorías:
Health
Se ha actualizado:
23 abr 2017 año
Los indicadores de los cambios de valor en los últimos años
Mínimo:
104.0
1 ene 2005 año
Máximo:
2.375 mil
1 ene 1961 año
A la fecha de observación
Valor
Cambio absoluto
El cambio con respecto al valor anterior
1 ene 1961 año
2.375 mil
+2.375 mil
0.0%
1 ene 1962 año
2.143 mil
-232.0
-9.77%
1 ene 1963 año
1.912 mil
-231.0
-10.78%
1 ene 1964 año
1.706 mil
-206.0
-10.77%
1 ene 1965 año
1.536 mil
-170.0
-9.96%
1 ene 1966 año
1.387 mil
-149.0
-9.7%
1 ene 1967 año
1.268 mil
-119.0
-8.58%
1 ene 1968 año
1.156 mil
-112.0
-8.83%
1 ene 1969 año
1.06 mil
-96.0
-8.3%
1 ene 1970 año
986.0
-74.0
-6.98%
1 ene 1971 año
946.0
-40.0
-4.06%
1 ene 1972 año
927.0
-19.0
-2.01%
1 ene 1973 año
905.0
-22.0
-2.37%
1 ene 1974 año
860.0
-45.0
-4.97%
1 ene 1975 año
794.0
-66.0
-7.67%
1 ene 1976 año
705.0
-89.0
-11.21%
1 ene 1977 año
609.0
-96.0
-13.62%
1 ene 1978 año
528.0
-81.0
-13.3%
1 ene 1979 año
474.0
-54.0
-10.23%
1 ene 1980 año
432.0
-42.0
-8.86%
1 ene 1981 año
406.0
-26.0
-6.02%
1 ene 1982 año
398.0
-8.0
-1.97%
1 ene 1983 año
407.0
+9.0
2.26%
1 ene 1984 año
422.0
+15.0
3.69%
1 ene 1985 año
433.0
+11.0
2.61%
1 ene 1986 año
426.0
-7.0
-1.62%
1 ene 1987 año
409.0
-17.0
-3.99%
1 ene 1988 año
376.0
-33.0
-8.07%
1 ene 1989 año
341.0
-35.0
-9.31%
1 ene 1990 año
304.0
-37.0
-10.85%
1 ene 1991 año
289.0
-15.0
-4.93%
1 ene 1992 año
276.0
-13.0
-4.5%
1 ene 1993 año
277.0
+1.0
0.36%
1 ene 1994 año
281.0
+4.0
1.44%
1 ene 1995 año
280.0
-1.0
-0.36%
1 ene 1996 año
272.0
-8.0
-2.86%
1 ene 1997 año
249.0
-23.0
-8.46%
1 ene 1998 año
223.0
-26.0
-10.44%
1 ene 1999 año
188.0
-35.0
-15.7%
1 ene 2000 año
158.0
-30.0
-15.96%
1 ene 2001 año
132.0
-26.0
-16.46%
1 ene 2002 año
119.0
-13.0
-9.85%
1 ene 2003 año
107.0
-12.0
-10.08%
1 ene 2004 año
108.0
+1.0
0.93%
1 ene 2005 año
104.0
-4.0
-3.7%
1 ene 2006 año
108.0
+4.0
3.85%
1 ene 2007 año
111.0
+3.0
2.78%
1 ene 2008 año
113.0
+2.0
1.8%
1 ene 2009 año
110.0
-3.0
-2.65%
1 ene 2010 año
112.0
+2.0
1.82%
1 ene 2011 año
113.0
+1.0
0.89%
1 ene 2012 año
115.0
+2.0
1.77%
1 ene 2013 año
116.0
+1.0
0.87%
1 ene 2014 año
117.0
+1.0
0.86%
1 ene 2015 año
118.0
+1.0
0.85%
1 ene 2016 año
112.0
-6.0
-5.08%
Ranking de los países por los datos estadísticos actuales


Comentarios: