29
/es/
es
AIzaSyAYiBZKx7MnpbEhh9jyipgxe19OcubqV5w
April 1, 2024
255787
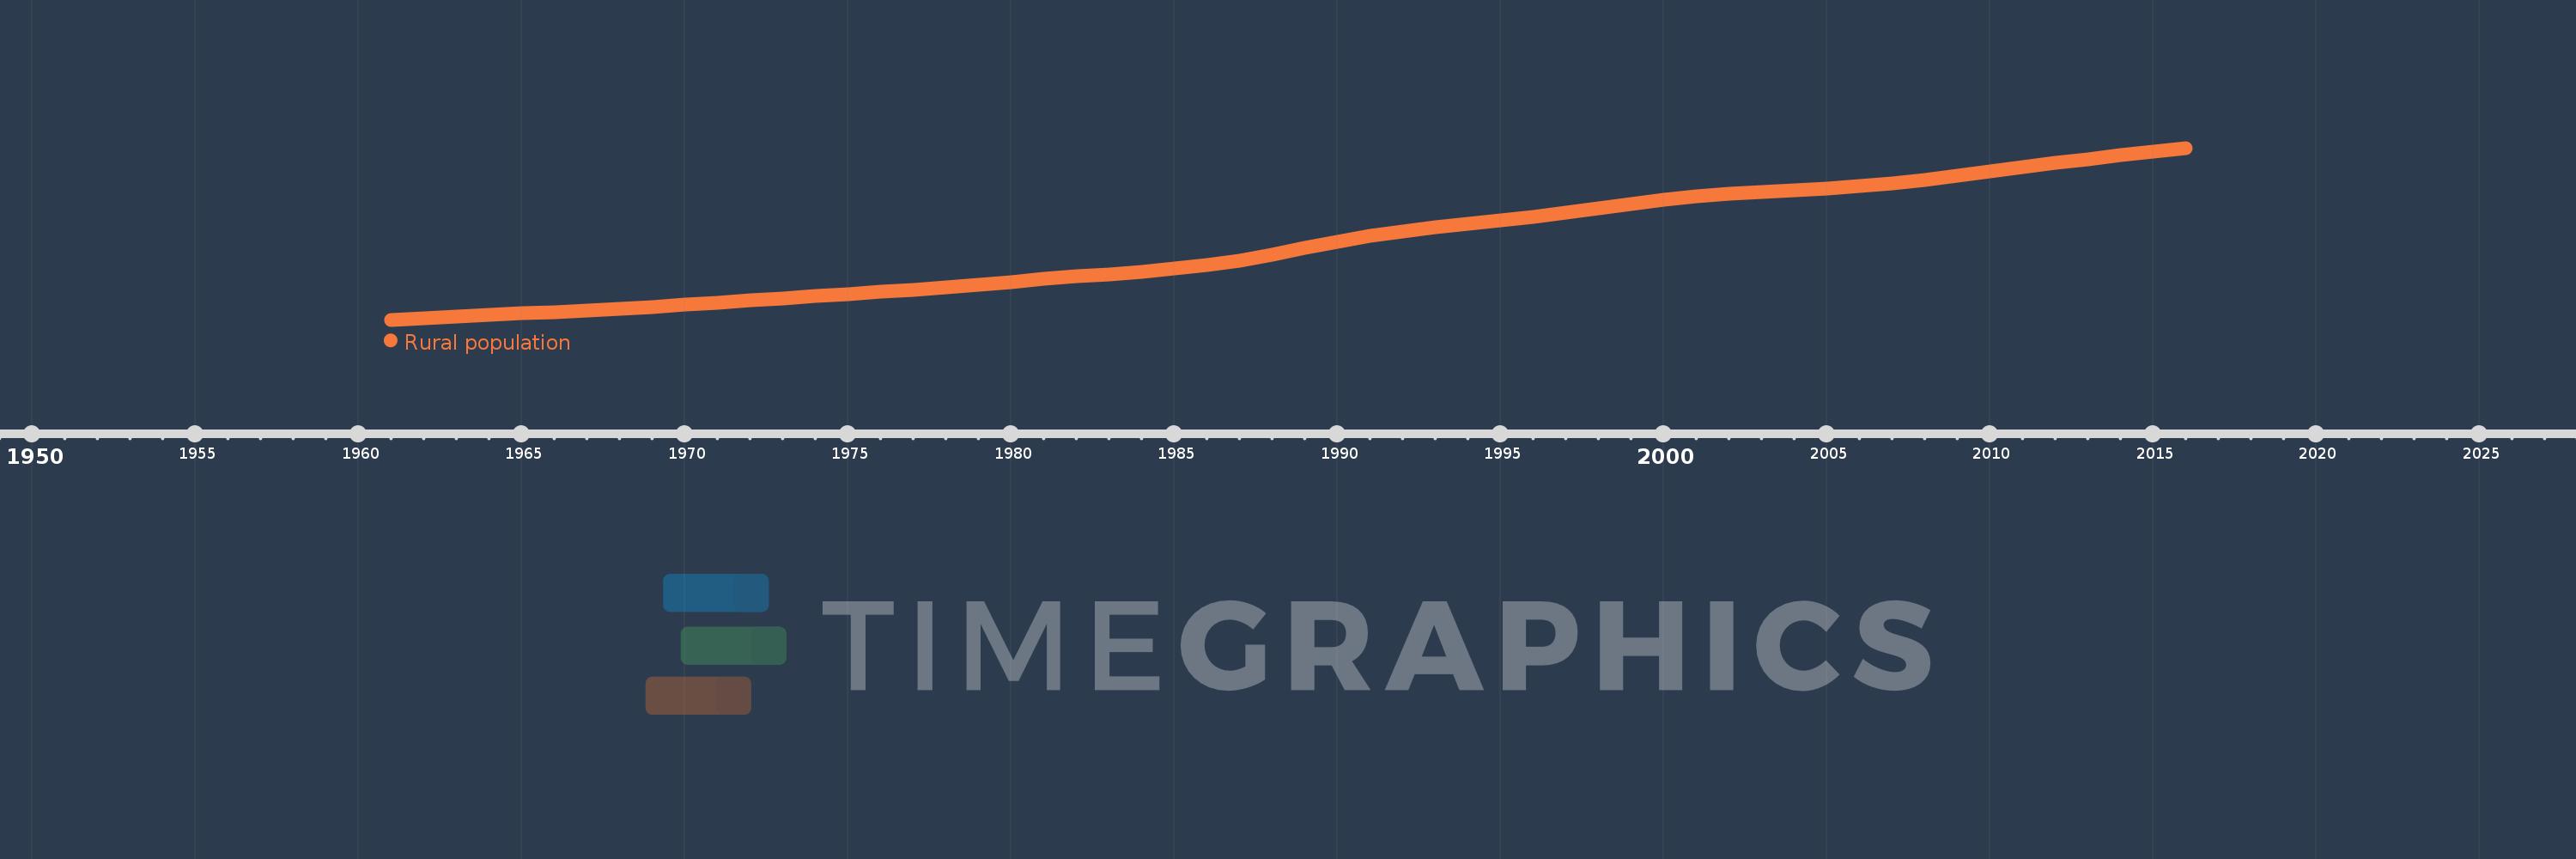
Swaziland
SWZ
true
2
1
Rural population
2016,2015,2014,2013,2012,2011,2010,2009,2008,2007,2006,2005,2004,2003,2002,2001,2000,1999,1998,1997,1996,1995,1994,1993,1992,1991,1990,1989,1988,1987,1986,1985,1984,1983,1982,1981,1980,1979,1978,1977,1976,1975,1974,1973,1972,1971,1970,1969,1968,1967,1966,1965,1964,1963,1962,1961
Estas estadísticas en otros países:
AfghanistanAlbaniaAlgeriaAmerican SamoaAndorraAngolaAntigua and BarbudaArab WorldArgentinaArmeniaArubaAustraliaAustriaAzerbaijanBahamas, TheBahrainBangladeshBarbadosBelarusBelgiumBelizeBeninBermudaBhutanBoliviaBosnia and HerzegovinaBotswanaBrazilBritish Virgin IslandsBrunei DarussalamBulgariaBurkina FasoBurundiCabo VerdeCambodiaCameroonCanadaCaribbean small statesCayman IslandsCentral African RepublicCentral Europe and the BalticsChadChannel IslandsChileChinaColombiaComorosCongo, Dem. Rep.Congo, Rep.Costa RicaCote d'IvoireCroatiaCubaCuracaoCyprusCzech RepublicDenmarkDjiboutiDominicaDominican RepublicEarly-demographic dividendEast Asia & PacificEast Asia & Pacific (excluding high income)East Asia & Pacific (IDA & IBRD countries)EcuadorEgypt, Arab Rep.El SalvadorEquatorial GuineaEritreaEstoniaEthiopiaEuro areaEurope & Central AsiaEurope & Central Asia (excluding high income)Europe & Central Asia (IDA & IBRD countries)European UnionFaroe IslandsFijiFinlandFragile and conflict affected situationsFranceFrench PolynesiaGabonGambia, TheGeorgiaGermanyGhanaGibraltarGreeceGreenlandGrenadaGuamGuatemalaGuineaGuinea-BissauGuyanaHaitiHeavily indebted poor countries (HIPC)High incomeHondurasHong Kong SAR, ChinaHungaryIBRD onlyIcelandIDA & IBRD totalIDA blendIDA onlyIDA totalIndiaIndonesiaIran, Islamic Rep.IraqIrelandIsle of ManIsraelItalyJamaicaJapanJordanKazakhstanKenyaKiribatiKorea, Dem. People’s Rep.Korea, Rep.KuwaitKyrgyz RepublicLao PDRLate-demographic dividendLatin America & Caribbean Latin America & Caribbean (excluding high income)Latin America & the Caribbean (IDA & IBRD countries)LatviaLeast developed countries: UN classificationLebanonLesothoLiberiaLibyaLiechtensteinLithuaniaLow & middle incomeLow incomeLower middle incomeLuxembourgMacao SAR, ChinaMacedonia, FYRMadagascarMalawiMalaysiaMaldivesMaliMaltaMarshall IslandsMauritaniaMauritiusMexicoMicronesia, Fed. Sts.Middle East & North AfricaMiddle East & North Africa (excluding high income)Middle East & North Africa (IDA & IBRD countries)Middle incomeMoldovaMonacoMongoliaMontenegroMoroccoMozambiqueMyanmarNamibiaNauruNepalNetherlandsNew CaledoniaNew ZealandNicaraguaNigerNigeriaNorth AmericaNorthern Mariana IslandsNorwayOECD membersOmanOther small statesPacific island small statesPakistanPalauPanamaPapua New GuineaParaguayPeruPhilippinesPolandPortugalPost-demographic dividendPre-demographic dividendPuerto RicoQatarRomaniaRussian FederationRwandaSamoaSan MarinoSao Tome and PrincipeSaudi ArabiaSenegalSerbiaSeychellesSierra LeoneSingaporeSint Maarten (Dutch part)Slovak RepublicSloveniaSmall statesSolomon IslandsSomaliaSouth AfricaSouth AsiaSouth Asia (IDA & IBRD)South SudanSpainSri LankaSt. Kitts and NevisSt. LuciaSt. Vincent and the GrenadinesSub-Saharan Africa Sub-Saharan Africa (excluding high income)Sub-Saharan Africa (IDA & IBRD countries)SudanSurinameSwazilandSwedenSwitzerlandSyrian Arab RepublicTajikistanTanzaniaThailandTimor-LesteTogoTongaTrinidad and TobagoTunisiaTurkeyTurkmenistanTurks and Caicos IslandsTuvaluUgandaUkraineUnited Arab EmiratesUnited KingdomUnited StatesUpper middle incomeUruguayUzbekistanVanuatuVenezuela, RBVietnamVirgin Islands (U.S.)West Bank and GazaWorldYemen, Rep.ZambiaZimbabwe línea de tiempo (timeline):
En esta escala de tiempo se presenta un gráfico de 1961 y 2016 de Swaziland. Los datos de 1960 están ausentes. El número de observaciones reales por fecha: 56.
Fuente (nombre):
Indicadores del desarrollo mundial
Fuente (organización):
The data on urban population shares used to estimate rural population come from the United Nations, World Urbanization Prospects. Total population figures are World Bank estimates.
Categorías:
Agriculture & Rural Development
Se ha actualizado:
23 abr 2017 año
Los indicadores de los cambios de valor en los últimos años
Mínimo:
335.568 mil
1 ene 1961 año
Máximo:
1.013 millones
1 ene 2016 año
A la fecha de observación
Valor
Cambio absoluto
El cambio con respecto al valor anterior
1 ene 1961 año
335.568 mil
+335.568 mil
0.0%
1 ene 1962 año
342.023 mil
+6.455 mil
1.92%
1 ene 1963 año
348.164 mil
+6.141 mil
1.8%
1 ene 1964 año
354.125 mil
+5.961 mil
1.71%
1 ene 1965 año
360.095 mil
+5.97 mil
1.69%
1 ene 1966 año
366.225 mil
+6.13 mil
1.7%
1 ene 1967 año
372.574 mil
+6.349 mil
1.73%
1 ene 1968 año
379.675 mil
+7.101 mil
1.91%
1 ene 1969 año
387.032 mil
+7.357 mil
1.94%
1 ene 1970 año
394.671 mil
+7.639 mil
1.97%
1 ene 1971 año
402.575 mil
+7.904 mil
2.0%
1 ene 1972 año
410.744 mil
+8.169 mil
2.03%
1 ene 1973 año
419.133 mil
+8.389 mil
2.04%
1 ene 1974 año
427.673 mil
+8.54 mil
2.04%
1 ene 1975 año
436.223 mil
+8.55 mil
2.0%
1 ene 1976 año
444.685 mil
+8.462 mil
1.94%
1 ene 1977 año
453.077 mil
+8.392 mil
1.89%
1 ene 1978 año
463.472 mil
+10.395 mil
2.29%
1 ene 1979 año
474.327 mil
+10.855 mil
2.34%
1 ene 1980 año
485.102 mil
+10.775 mil
2.27%
1 ene 1981 año
495.695 mil
+10.593 mil
2.18%
1 ene 1982 año
505.818 mil
+10.123 mil
2.04%
1 ene 1983 año
515.577 mil
+9.759 mil
1.93%
1 ene 1984 año
525.816 mil
+10.239 mil
1.99%
1 ene 1985 año
537.638 mil
+11.822 mil
2.25%
1 ene 1986 año
551.667 mil
+14.029 mil
2.61%
1 ene 1987 año
568.228 mil
+16.561 mil
3.0%
1 ene 1988 año
592.262 mil
+24.034 mil
4.23%
1 ene 1989 año
618.225 mil
+25.963 mil
4.38%
1 ene 1990 año
643.017 mil
+24.792 mil
4.01%
1 ene 1991 año
665.094 mil
+22.077 mil
3.43%
1 ene 1992 año
683.758 mil
+18.664 mil
2.81%
1 ene 1993 año
699.446 mil
+15.688 mil
2.29%
1 ene 1994 año
713.267 mil
+13.821 mil
1.98%
1 ene 1995 año
726.863 mil
+13.596 mil
1.91%
1 ene 1996 año
741.377 mil
+14.514 mil
2.0%
1 ene 1997 año
757.321 mil
+15.944 mil
2.15%
1 ene 1998 año
774.39 mil
+17.069 mil
2.25%
1 ene 1999 año
792.619 mil
+18.229 mil
2.35%
1 ene 2000 año
808.994 mil
+16.375 mil
2.07%
1 ene 2001 año
822.401 mil
+13.407 mil
1.66%
1 ene 2002 año
832.352 mil
+9.951 mil
1.21%
1 ene 2003 año
839.513 mil
+7.161 mil
0.86%
1 ene 2004 año
845.38 mil
+5.867 mil
0.7%
1 ene 2005 año
852.107 mil
+6.727 mil
0.8%
1 ene 2006 año
861.201 mil
+9.094 mil
1.07%
1 ene 2007 año
873.206 mil
+12.005 mil
1.39%
1 ene 2008 año
887.648 mil
+14.442 mil
1.65%
1 ene 2009 año
903.732 mil
+16.084 mil
1.81%
1 ene 2010 año
920.352 mil
+16.62 mil
1.84%
1 ene 2011 año
936.717 mil
+16.365 mil
1.78%
1 ene 2012 año
952.689 mil
+15.972 mil
1.71%
1 ene 2013 año
968.432 mil
+15.743 mil
1.65%
1 ene 2014 año
983.792 mil
+15.36 mil
1.59%
1 ene 2015 año
998.601 mil
+14.809 mil
1.51%
1 ene 2016 año
1.013 millones
+14.141 mil
1.42%
Ranking de los países por los datos estadísticos actuales


Comentarios: