29
/es/
es
AIzaSyAYiBZKx7MnpbEhh9jyipgxe19OcubqV5w
April 1, 2024
200983
Montenegro
MNE
true
2
1
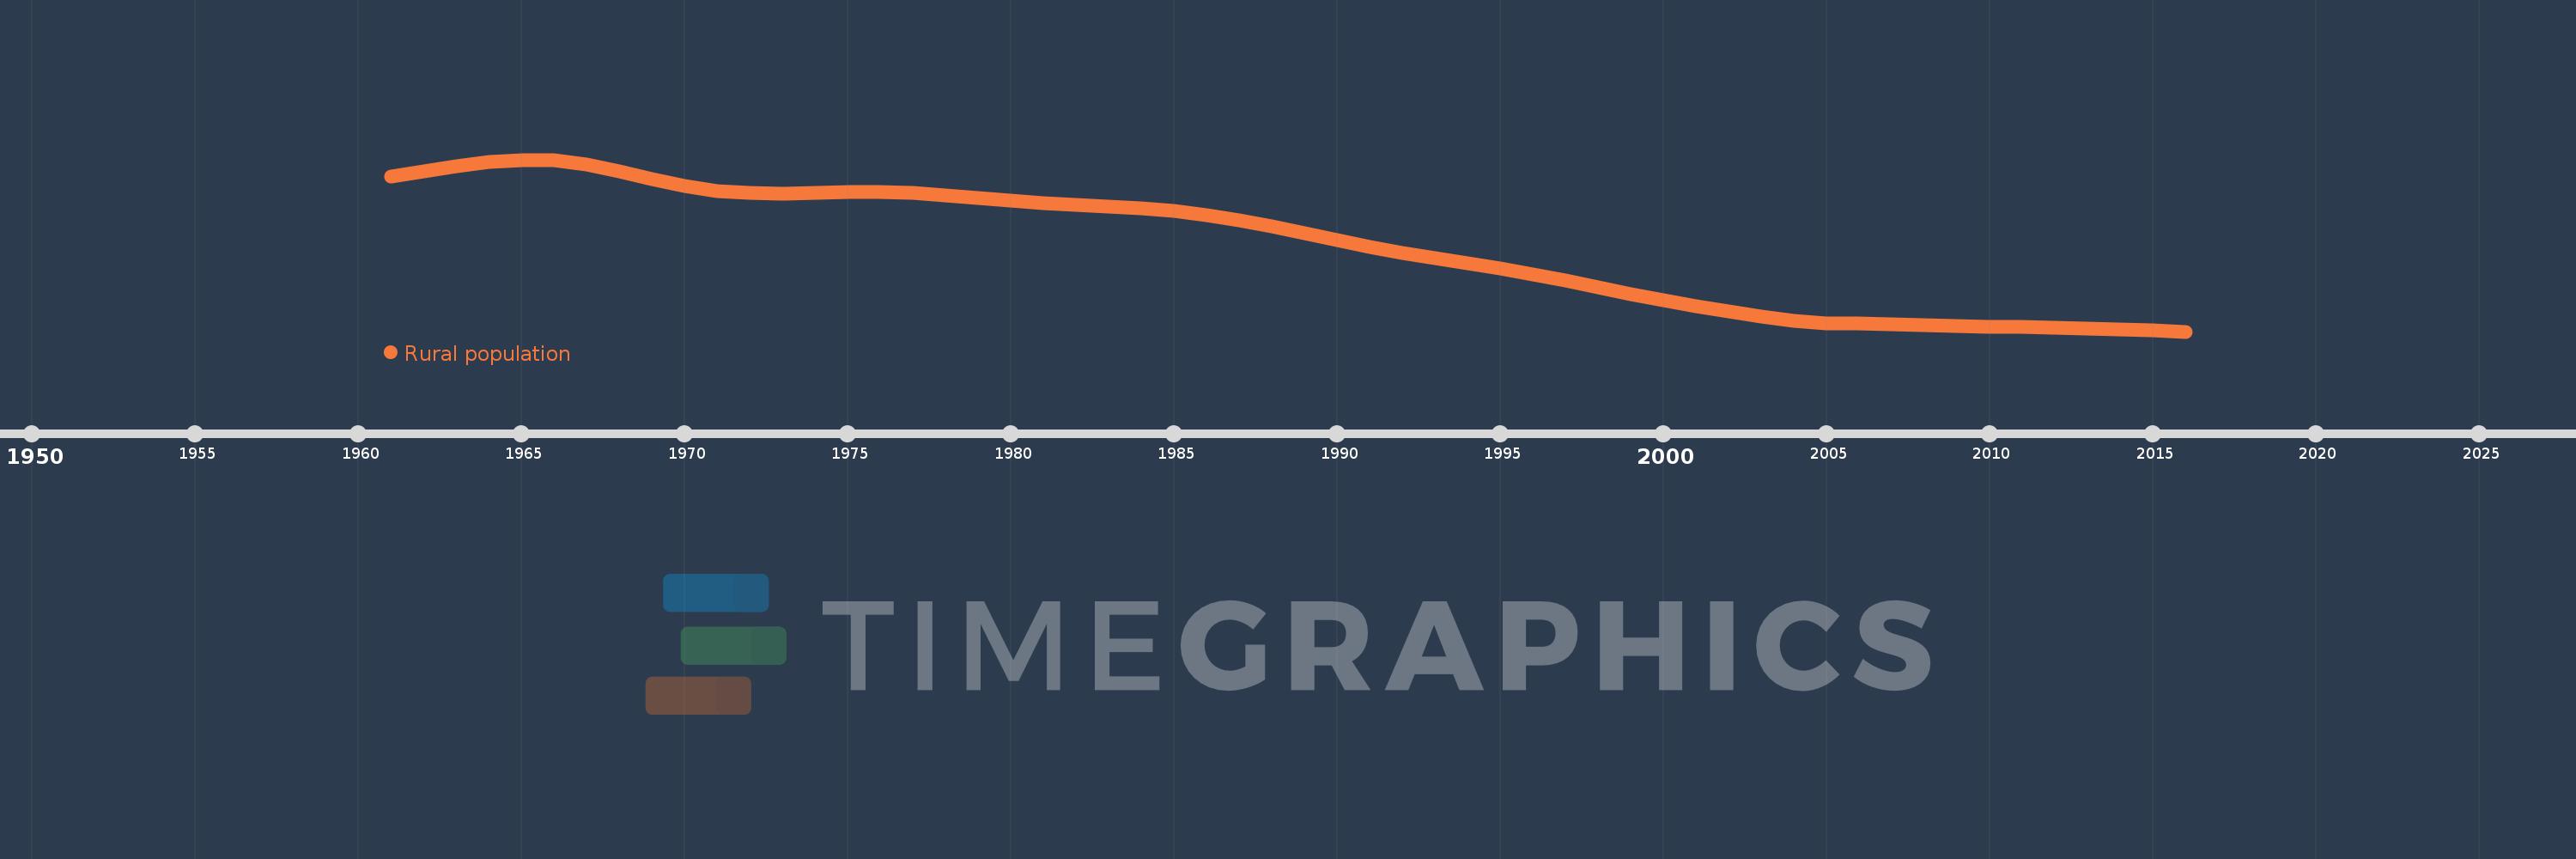
Rural population
2016,2015,2014,2013,2012,2011,2010,2009,2008,2007,2006,2005,2004,2003,2002,2001,2000,1999,1998,1997,1996,1995,1994,1993,1992,1991,1990,1989,1988,1987,1986,1985,1984,1983,1982,1981,1980,1979,1978,1977,1976,1975,1974,1973,1972,1971,1970,1969,1968,1967,1966,1965,1964,1963,1962,1961
Estas estadísticas en otros países:
AfghanistanAlbaniaAlgeriaAmerican SamoaAndorraAngolaAntigua and BarbudaArab WorldArgentinaArmeniaArubaAustraliaAustriaAzerbaijanBahamas, TheBahrainBangladeshBarbadosBelarusBelgiumBelizeBeninBermudaBhutanBoliviaBosnia and HerzegovinaBotswanaBrazilBritish Virgin IslandsBrunei DarussalamBulgariaBurkina FasoBurundiCabo VerdeCambodiaCameroonCanadaCaribbean small statesCayman IslandsCentral African RepublicCentral Europe and the BalticsChadChannel IslandsChileChinaColombiaComorosCongo, Dem. Rep.Congo, Rep.Costa RicaCote d'IvoireCroatiaCubaCuracaoCyprusCzech RepublicDenmarkDjiboutiDominicaDominican RepublicEarly-demographic dividendEast Asia & PacificEast Asia & Pacific (excluding high income)East Asia & Pacific (IDA & IBRD countries)EcuadorEgypt, Arab Rep.El SalvadorEquatorial GuineaEritreaEstoniaEthiopiaEuro areaEurope & Central AsiaEurope & Central Asia (excluding high income)Europe & Central Asia (IDA & IBRD countries)European UnionFaroe IslandsFijiFinlandFragile and conflict affected situationsFranceFrench PolynesiaGabonGambia, TheGeorgiaGermanyGhanaGibraltarGreeceGreenlandGrenadaGuamGuatemalaGuineaGuinea-BissauGuyanaHaitiHeavily indebted poor countries (HIPC)High incomeHondurasHong Kong SAR, ChinaHungaryIBRD onlyIcelandIDA & IBRD totalIDA blendIDA onlyIDA totalIndiaIndonesiaIran, Islamic Rep.IraqIrelandIsle of ManIsraelItalyJamaicaJapanJordanKazakhstanKenyaKiribatiKorea, Dem. People’s Rep.Korea, Rep.KuwaitKyrgyz RepublicLao PDRLate-demographic dividendLatin America & Caribbean Latin America & Caribbean (excluding high income)Latin America & the Caribbean (IDA & IBRD countries)LatviaLeast developed countries: UN classificationLebanonLesothoLiberiaLibyaLiechtensteinLithuaniaLow & middle incomeLow incomeLower middle incomeLuxembourgMacao SAR, ChinaMacedonia, FYRMadagascarMalawiMalaysiaMaldivesMaliMaltaMarshall IslandsMauritaniaMauritiusMexicoMicronesia, Fed. Sts.Middle East & North AfricaMiddle East & North Africa (excluding high income)Middle East & North Africa (IDA & IBRD countries)Middle incomeMoldovaMonacoMongoliaMontenegroMoroccoMozambiqueMyanmarNamibiaNauruNepalNetherlandsNew CaledoniaNew ZealandNicaraguaNigerNigeriaNorth AmericaNorthern Mariana IslandsNorwayOECD membersOmanOther small statesPacific island small statesPakistanPalauPanamaPapua New GuineaParaguayPeruPhilippinesPolandPortugalPost-demographic dividendPre-demographic dividendPuerto RicoQatarRomaniaRussian FederationRwandaSamoaSan MarinoSao Tome and PrincipeSaudi ArabiaSenegalSerbiaSeychellesSierra LeoneSingaporeSint Maarten (Dutch part)Slovak RepublicSloveniaSmall statesSolomon IslandsSomaliaSouth AfricaSouth AsiaSouth Asia (IDA & IBRD)South SudanSpainSri LankaSt. Kitts and NevisSt. LuciaSt. Vincent and the GrenadinesSub-Saharan Africa Sub-Saharan Africa (excluding high income)Sub-Saharan Africa (IDA & IBRD countries)SudanSurinameSwazilandSwedenSwitzerlandSyrian Arab RepublicTajikistanTanzaniaThailandTimor-LesteTogoTongaTrinidad and TobagoTunisiaTurkeyTurkmenistanTurks and Caicos IslandsTuvaluUgandaUkraineUnited Arab EmiratesUnited KingdomUnited StatesUpper middle incomeUruguayUzbekistanVanuatuVenezuela, RBVietnamVirgin Islands (U.S.)West Bank and GazaWorldYemen, Rep.ZambiaZimbabwe línea de tiempo (timeline):
En esta escala de tiempo se presenta un gráfico de 1961 y 2016 de Montenegro. Los datos de 1960 están ausentes. El número de observaciones reales por fecha: 56.
Fuente (nombre):
Indicadores del desarrollo mundial
Fuente (organización):
The data on urban population shares used to estimate rural population come from the United Nations, World Urbanization Prospects. Total population figures are World Bank estimates.
Categorías:
Agriculture & Rural Development
Se ha actualizado:
23 abr 2017 año
Los indicadores de los cambios de valor en los últimos años
Mínimo:
223.898 mil
1 ene 2016 año
Máximo:
408.167 mil
1 ene 1965 año
A la fecha de observación
Valor
Cambio absoluto
El cambio con respecto al valor anterior
1 ene 1961 año
390.288 mil
+390.288 mil
0.0%
1 ene 1962 año
395.358 mil
+5.07 mil
1.3%
1 ene 1963 año
400.855 mil
+5.497 mil
1.39%
1 ene 1964 año
405.629 mil
+4.774 mil
1.19%
1 ene 1965 año
408.167 mil
+2.538 mil
0.63%
1 ene 1966 año
407.556 mil
-611.0
-0.15%
1 ene 1967 año
403.326 mil
-4.23 mil
-1.04%
1 ene 1968 año
396.175 mil
-7.151 mil
-1.77%
1 ene 1969 año
387.702 mil
-8.473 mil
-2.14%
1 ene 1970 año
380.103 mil
-7.599 mil
-1.96%
1 ene 1971 año
374.81 mil
-5.293 mil
-1.39%
1 ene 1972 año
372.314 mil
-2.496 mil
-0.67%
1 ene 1973 año
372.001 mil
-313.0
-0.08%
1 ene 1974 año
372.962 mil
+961.0
0.26%
1 ene 1975 año
373.826 mil
+864.0
0.23%
1 ene 1976 año
373.677 mil
-149.0
-0.04%
1 ene 1977 año
372.261 mil
-1.416 mil
-0.38%
1 ene 1978 año
369.941 mil
-2.32 mil
-0.62%
1 ene 1979 año
367.085 mil
-2.856 mil
-0.77%
1 ene 1980 año
364.26 mil
-2.825 mil
-0.77%
1 ene 1981 año
361.814 mil
-2.446 mil
-0.67%
1 ene 1982 año
359.882 mil
-1.932 mil
-0.53%
1 ene 1983 año
358.165 mil
-1.717 mil
-0.48%
1 ene 1984 año
356.18 mil
-1.985 mil
-0.55%
1 ene 1985 año
353.296 mil
-2.884 mil
-0.81%
1 ene 1986 año
349.163 mil
-4.133 mil
-1.17%
1 ene 1987 año
343.624 mil
-5.539 mil
-1.59%
1 ene 1988 año
336.948 mil
-6.676 mil
-1.94%
1 ene 1989 año
329.588 mil
-7.36 mil
-2.18%
1 ene 1990 año
322.174 mil
-7.414 mil
-2.25%
1 ene 1991 año
315.089 mil
-7.085 mil
-2.2%
1 ene 1992 año
308.622 mil
-6.467 mil
-2.05%
1 ene 1993 año
302.931 mil
-5.691 mil
-1.84%
1 ene 1994 año
297.354 mil
-5.577 mil
-1.84%
1 ene 1995 año
291.529 mil
-5.825 mil
-1.96%
1 ene 1996 año
285.272 mil
-6.257 mil
-2.15%
1 ene 1997 año
278.544 mil
-6.728 mil
-2.36%
1 ene 1998 año
271.535 mil
-7.009 mil
-2.52%
1 ene 1999 año
264.406 mil
-7.129 mil
-2.63%
1 ene 2000 año
257.441 mil
-6.965 mil
-2.63%
1 ene 2001 año
250.788 mil
-6.653 mil
-2.58%
1 ene 2002 año
245.634 mil
-5.154 mil
-2.06%
1 ene 2003 año
240.467 mil
-5.167 mil
-2.1%
1 ene 2004 año
235.306 mil
-5.161 mil
-2.15%
1 ene 2005 año
232.951 mil
-2.355 mil
-1.0%
1 ene 2006 año
232.191 mil
-760.0
-0.33%
1 ene 2007 año
231.372 mil
-819.0
-0.35%
1 ene 2008 año
230.584 mil
-788.0
-0.34%
1 ene 2009 año
229.889 mil
-695.0
-0.3%
1 ene 2010 año
229.276 mil
-613.0
-0.27%
1 ene 2011 año
228.594 mil
-682.0
-0.3%
1 ene 2012 año
227.73 mil
-864.0
-0.38%
1 ene 2013 año
226.786 mil
-944.0
-0.41%
1 ene 2014 año
225.852 mil
-934.0
-0.41%
1 ene 2015 año
224.896 mil
-956.0
-0.42%
1 ene 2016 año
223.898 mil
-998.0
-0.44%
Ranking de los países por los datos estadísticos actuales


Comentarios: