29
/es/
es
AIzaSyAYiBZKx7MnpbEhh9jyipgxe19OcubqV5w
April 1, 2024
251355
St. Lucia
LCA
true
2
1
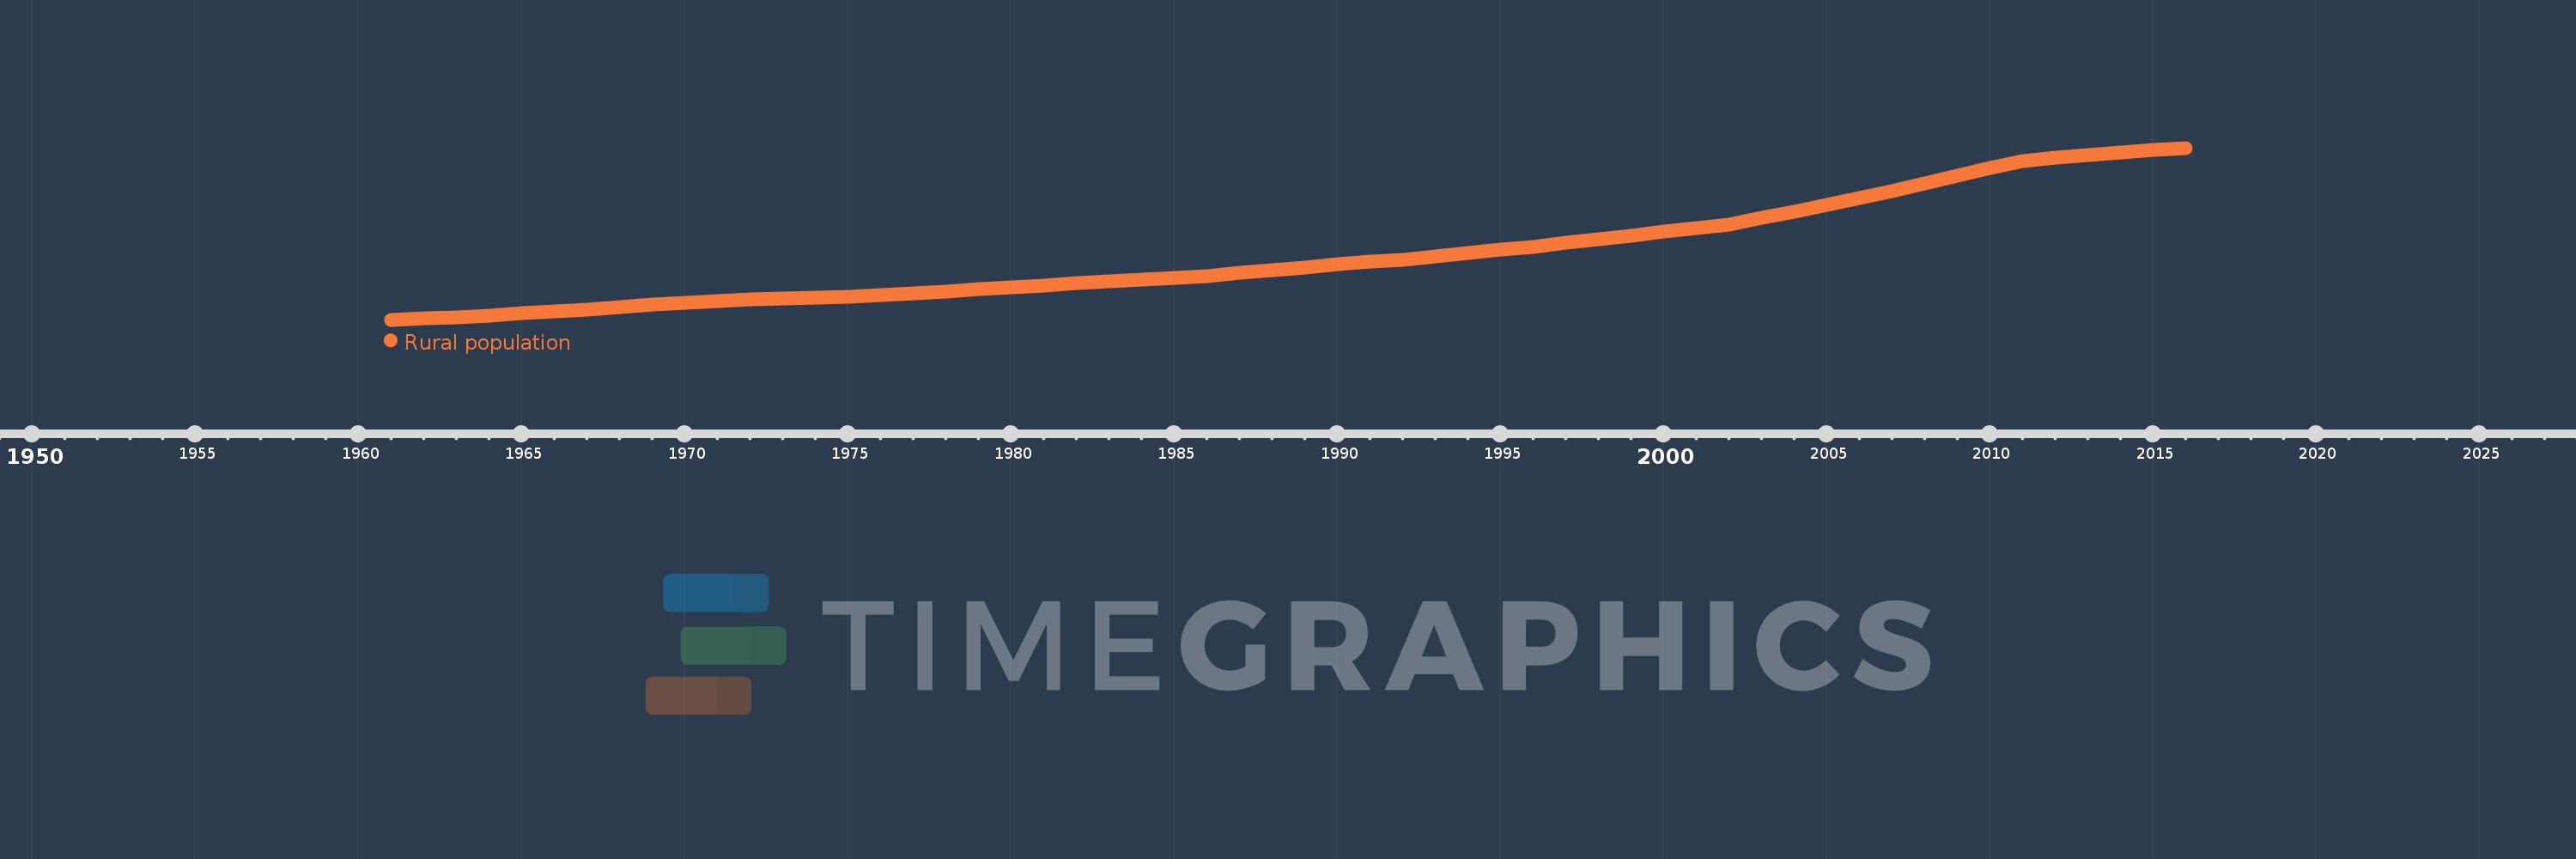
Rural population
2016,2015,2014,2013,2012,2011,2010,2009,2008,2007,2006,2005,2004,2003,2002,2001,2000,1999,1998,1997,1996,1995,1994,1993,1992,1991,1990,1989,1988,1987,1986,1985,1984,1983,1982,1981,1980,1979,1978,1977,1976,1975,1974,1973,1972,1971,1970,1969,1968,1967,1966,1965,1964,1963,1962,1961
Estas estadísticas en otros países:
AfghanistanAlbaniaAlgeriaAmerican SamoaAndorraAngolaAntigua and BarbudaArab WorldArgentinaArmeniaArubaAustraliaAustriaAzerbaijanBahamas, TheBahrainBangladeshBarbadosBelarusBelgiumBelizeBeninBermudaBhutanBoliviaBosnia and HerzegovinaBotswanaBrazilBritish Virgin IslandsBrunei DarussalamBulgariaBurkina FasoBurundiCabo VerdeCambodiaCameroonCanadaCaribbean small statesCayman IslandsCentral African RepublicCentral Europe and the BalticsChadChannel IslandsChileChinaColombiaComorosCongo, Dem. Rep.Congo, Rep.Costa RicaCote d'IvoireCroatiaCubaCuracaoCyprusCzech RepublicDenmarkDjiboutiDominicaDominican RepublicEarly-demographic dividendEast Asia & PacificEast Asia & Pacific (excluding high income)East Asia & Pacific (IDA & IBRD countries)EcuadorEgypt, Arab Rep.El SalvadorEquatorial GuineaEritreaEstoniaEthiopiaEuro areaEurope & Central AsiaEurope & Central Asia (excluding high income)Europe & Central Asia (IDA & IBRD countries)European UnionFaroe IslandsFijiFinlandFragile and conflict affected situationsFranceFrench PolynesiaGabonGambia, TheGeorgiaGermanyGhanaGibraltarGreeceGreenlandGrenadaGuamGuatemalaGuineaGuinea-BissauGuyanaHaitiHeavily indebted poor countries (HIPC)High incomeHondurasHong Kong SAR, ChinaHungaryIBRD onlyIcelandIDA & IBRD totalIDA blendIDA onlyIDA totalIndiaIndonesiaIran, Islamic Rep.IraqIrelandIsle of ManIsraelItalyJamaicaJapanJordanKazakhstanKenyaKiribatiKorea, Dem. People’s Rep.Korea, Rep.KuwaitKyrgyz RepublicLao PDRLate-demographic dividendLatin America & Caribbean Latin America & Caribbean (excluding high income)Latin America & the Caribbean (IDA & IBRD countries)LatviaLeast developed countries: UN classificationLebanonLesothoLiberiaLibyaLiechtensteinLithuaniaLow & middle incomeLow incomeLower middle incomeLuxembourgMacao SAR, ChinaMacedonia, FYRMadagascarMalawiMalaysiaMaldivesMaliMaltaMarshall IslandsMauritaniaMauritiusMexicoMicronesia, Fed. Sts.Middle East & North AfricaMiddle East & North Africa (excluding high income)Middle East & North Africa (IDA & IBRD countries)Middle incomeMoldovaMonacoMongoliaMontenegroMoroccoMozambiqueMyanmarNamibiaNauruNepalNetherlandsNew CaledoniaNew ZealandNicaraguaNigerNigeriaNorth AmericaNorthern Mariana IslandsNorwayOECD membersOmanOther small statesPacific island small statesPakistanPalauPanamaPapua New GuineaParaguayPeruPhilippinesPolandPortugalPost-demographic dividendPre-demographic dividendPuerto RicoQatarRomaniaRussian FederationRwandaSamoaSan MarinoSao Tome and PrincipeSaudi ArabiaSenegalSerbiaSeychellesSierra LeoneSingaporeSint Maarten (Dutch part)Slovak RepublicSloveniaSmall statesSolomon IslandsSomaliaSouth AfricaSouth AsiaSouth Asia (IDA & IBRD)South SudanSpainSri LankaSt. Kitts and NevisSt. LuciaSt. Vincent and the GrenadinesSub-Saharan Africa Sub-Saharan Africa (excluding high income)Sub-Saharan Africa (IDA & IBRD countries)SudanSurinameSwazilandSwedenSwitzerlandSyrian Arab RepublicTajikistanTanzaniaThailandTimor-LesteTogoTongaTrinidad and TobagoTunisiaTurkeyTurkmenistanTurks and Caicos IslandsTuvaluUgandaUkraineUnited Arab EmiratesUnited KingdomUnited StatesUpper middle incomeUruguayUzbekistanVanuatuVenezuela, RBVietnamVirgin Islands (U.S.)West Bank and GazaWorldYemen, Rep.ZambiaZimbabwe línea de tiempo (timeline):
En esta escala de tiempo se presenta un gráfico de 1961 y 2016 de St. Lucia. Los datos de 1960 están ausentes. El número de observaciones reales por fecha: 56.
Fuente (nombre):
Indicadores del desarrollo mundial
Fuente (organización):
The data on urban population shares used to estimate rural population come from the United Nations, World Urbanization Prospects. Total population figures are World Bank estimates.
Categorías:
Agriculture & Rural Development
Se ha actualizado:
23 abr 2017 año
Los indicadores de los cambios de valor en los últimos años
Mínimo:
70.608 mil
1 ene 1961 año
Máximo:
150.767 mil
1 ene 2016 año
A la fecha de observación
Valor
Cambio absoluto
El cambio con respecto al valor anterior
1 ene 1961 año
70.608 mil
+70.608 mil
0.0%
1 ene 1962 año
71.189 mil
+581.0
0.82%
1 ene 1963 año
71.888 mil
+699.0
0.98%
1 ene 1964 año
72.687 mil
+799.0
1.11%
1 ene 1965 año
73.56 mil
+873.0
1.2%
1 ene 1966 año
74.481 mil
+921.0
1.25%
1 ene 1967 año
75.458 mil
+977.0
1.31%
1 ene 1968 año
76.483 mil
+1.025 mil
1.36%
1 ene 1969 año
77.502 mil
+1.019 mil
1.33%
1 ene 1970 año
78.443 mil
+941.0
1.21%
1 ene 1971 año
79.26 mil
+817.0
1.04%
1 ene 1972 año
79.925 mil
+665.0
0.84%
1 ene 1973 año
80.462 mil
+537.0
0.67%
1 ene 1974 año
80.943 mil
+481.0
0.6%
1 ene 1975 año
81.468 mil
+525.0
0.65%
1 ene 1976 año
82.108 mil
+640.0
0.79%
1 ene 1977 año
82.891 mil
+783.0
0.95%
1 ene 1978 año
83.796 mil
+905.0
1.09%
1 ene 1979 año
84.77 mil
+974.0
1.16%
1 ene 1980 año
85.744 mil
+974.0
1.15%
1 ene 1981 año
86.671 mil
+927.0
1.08%
1 ene 1982 año
87.528 mil
+857.0
0.99%
1 ene 1983 año
88.334 mil
+806.0
0.92%
1 ene 1984 año
89.152 mil
+818.0
0.93%
1 ene 1985 año
90.061 mil
+909.0
1.02%
1 ene 1986 año
91.117 mil
+1.056 mil
1.17%
1 ene 1987 año
92.343 mil
+1.226 mil
1.35%
1 ene 1988 año
93.704 mil
+1.361 mil
1.47%
1 ene 1989 año
95.11 mil
+1.406 mil
1.5%
1 ene 1990 año
96.444 mil
+1.334 mil
1.4%
1 ene 1991 año
97.626 mil
+1.182 mil
1.23%
1 ene 1992 año
98.711 mil
+1.085 mil
1.11%
1 ene 1993 año
100.249 mil
+1.538 mil
1.56%
1 ene 1994 año
101.711 mil
+1.462 mil
1.46%
1 ene 1995 año
103.187 mil
+1.476 mil
1.45%
1 ene 1996 año
104.744 mil
+1.557 mil
1.51%
1 ene 1997 año
106.411 mil
+1.667 mil
1.59%
1 ene 1998 año
108.163 mil
+1.752 mil
1.65%
1 ene 1999 año
109.95 mil
+1.787 mil
1.65%
1 ene 2000 año
111.698 mil
+1.748 mil
1.59%
1 ene 2001 año
113.358 mil
+1.66 mil
1.49%
1 ene 2002 año
115.064 mil
+1.706 mil
1.5%
1 ene 2003 año
118.034 mil
+2.97 mil
2.58%
1 ene 2004 año
120.976 mil
+2.942 mil
2.49%
1 ene 2005 año
124.014 mil
+3.038 mil
2.51%
1 ene 2006 año
127.223 mil
+3.209 mil
2.59%
1 ene 2007 año
130.658 mil
+3.435 mil
2.7%
1 ene 2008 año
134.272 mil
+3.614 mil
2.77%
1 ene 2009 año
137.957 mil
+3.685 mil
2.74%
1 ene 2010 año
141.536 mil
+3.579 mil
2.59%
1 ene 2011 año
144.667 mil
+3.131 mil
2.21%
1 ene 2012 año
146.201 mil
+1.534 mil
1.06%
1 ene 2013 año
147.516 mil
+1.315 mil
0.9%
1 ene 2014 año
148.653 mil
+1.137 mil
0.77%
1 ene 2015 año
149.713 mil
+1.06 mil
0.71%
1 ene 2016 año
150.767 mil
+1.054 mil
0.7%
Ranking de los países por los datos estadísticos actuales


Comentarios: