29
/es/
es
AIzaSyAYiBZKx7MnpbEhh9jyipgxe19OcubqV5w
April 1, 2024
245126
Somalia
SOM
true
2
1
Urban population growth (annual %)
2016,2015,2014,2013,2012,2011,2010,2009,2008,2007,2006,2005,2004,2003,2002,2001,2000,1999,1998,1997,1996,1995,1994,1993,1992,1991,1990,1989,1988,1987,1986,1985,1984,1983,1982,1981,1980,1979,1978,1977,1976,1975,1974,1973,1972,1971,1970,1969,1968,1967,1966,1965,1964,1963,1962,1961
Estas estadísticas en otros países:
AfghanistanAlbaniaAlgeriaAmerican SamoaAndorraAngolaAntigua and BarbudaArab WorldArgentinaArmeniaArubaAustraliaAustriaAzerbaijanBahamas, TheBahrainBangladeshBarbadosBelarusBelgiumBelizeBeninBermudaBhutanBoliviaBosnia and HerzegovinaBotswanaBrazilBritish Virgin IslandsBrunei DarussalamBulgariaBurkina FasoBurundiCabo VerdeCambodiaCameroonCanadaCaribbean small statesCayman IslandsCentral African RepublicCentral Europe and the BalticsChadChannel IslandsChileChinaColombiaComorosCongo, Dem. Rep.Congo, Rep.Costa RicaCote d'IvoireCroatiaCubaCuracaoCyprusCzech RepublicDenmarkDjiboutiDominicaDominican RepublicEarly-demographic dividendEast Asia & PacificEast Asia & Pacific (excluding high income)East Asia & Pacific (IDA & IBRD countries)EcuadorEgypt, Arab Rep.El SalvadorEquatorial GuineaEritreaEstoniaEthiopiaEuro areaEurope & Central AsiaEurope & Central Asia (excluding high income)Europe & Central Asia (IDA & IBRD countries)European UnionFaroe IslandsFijiFinlandFragile and conflict affected situationsFranceFrench PolynesiaGabonGambia, TheGeorgiaGermanyGhanaGibraltarGreeceGreenlandGrenadaGuamGuatemalaGuineaGuinea-BissauGuyanaHaitiHeavily indebted poor countries (HIPC)High incomeHondurasHong Kong SAR, ChinaHungaryIBRD onlyIcelandIDA & IBRD totalIDA blendIDA onlyIDA totalIndiaIndonesiaIran, Islamic Rep.IraqIrelandIsle of ManIsraelItalyJamaicaJapanJordanKazakhstanKenyaKiribatiKorea, Dem. People’s Rep.Korea, Rep.KuwaitKyrgyz RepublicLao PDRLate-demographic dividendLatin America & Caribbean Latin America & Caribbean (excluding high income)Latin America & the Caribbean (IDA & IBRD countries)LatviaLeast developed countries: UN classificationLebanonLesothoLiberiaLibyaLiechtensteinLithuaniaLow & middle incomeLow incomeLower middle incomeLuxembourgMacao SAR, ChinaMacedonia, FYRMadagascarMalawiMalaysiaMaldivesMaliMaltaMarshall IslandsMauritaniaMauritiusMexicoMicronesia, Fed. Sts.Middle East & North AfricaMiddle East & North Africa (excluding high income)Middle East & North Africa (IDA & IBRD countries)Middle incomeMoldovaMonacoMongoliaMontenegroMoroccoMozambiqueMyanmarNamibiaNauruNepalNetherlandsNew CaledoniaNew ZealandNicaraguaNigerNigeriaNorth AmericaNorthern Mariana IslandsNorwayOECD membersOmanOther small statesPacific island small statesPakistanPalauPanamaPapua New GuineaParaguayPeruPhilippinesPolandPortugalPost-demographic dividendPre-demographic dividendPuerto RicoQatarRomaniaRussian FederationRwandaSamoaSan MarinoSao Tome and PrincipeSaudi ArabiaSenegalSerbiaSeychellesSierra LeoneSingaporeSint Maarten (Dutch part)Slovak RepublicSloveniaSmall statesSolomon IslandsSomaliaSouth AfricaSouth AsiaSouth Asia (IDA & IBRD)South SudanSpainSri LankaSt. Kitts and NevisSt. LuciaSt. Vincent and the GrenadinesSub-Saharan Africa Sub-Saharan Africa (excluding high income)Sub-Saharan Africa (IDA & IBRD countries)SudanSurinameSwazilandSwedenSwitzerlandSyrian Arab RepublicTajikistanTanzaniaThailandTimor-LesteTogoTongaTrinidad and TobagoTunisiaTurkeyTurkmenistanTurks and Caicos IslandsTuvaluUgandaUkraineUnited Arab EmiratesUnited KingdomUnited StatesUpper middle incomeUruguayUzbekistanVanuatuVenezuela, RBVietnamVirgin Islands (U.S.)West Bank and GazaWorldYemen, Rep.ZambiaZimbabwe línea de tiempo (timeline):
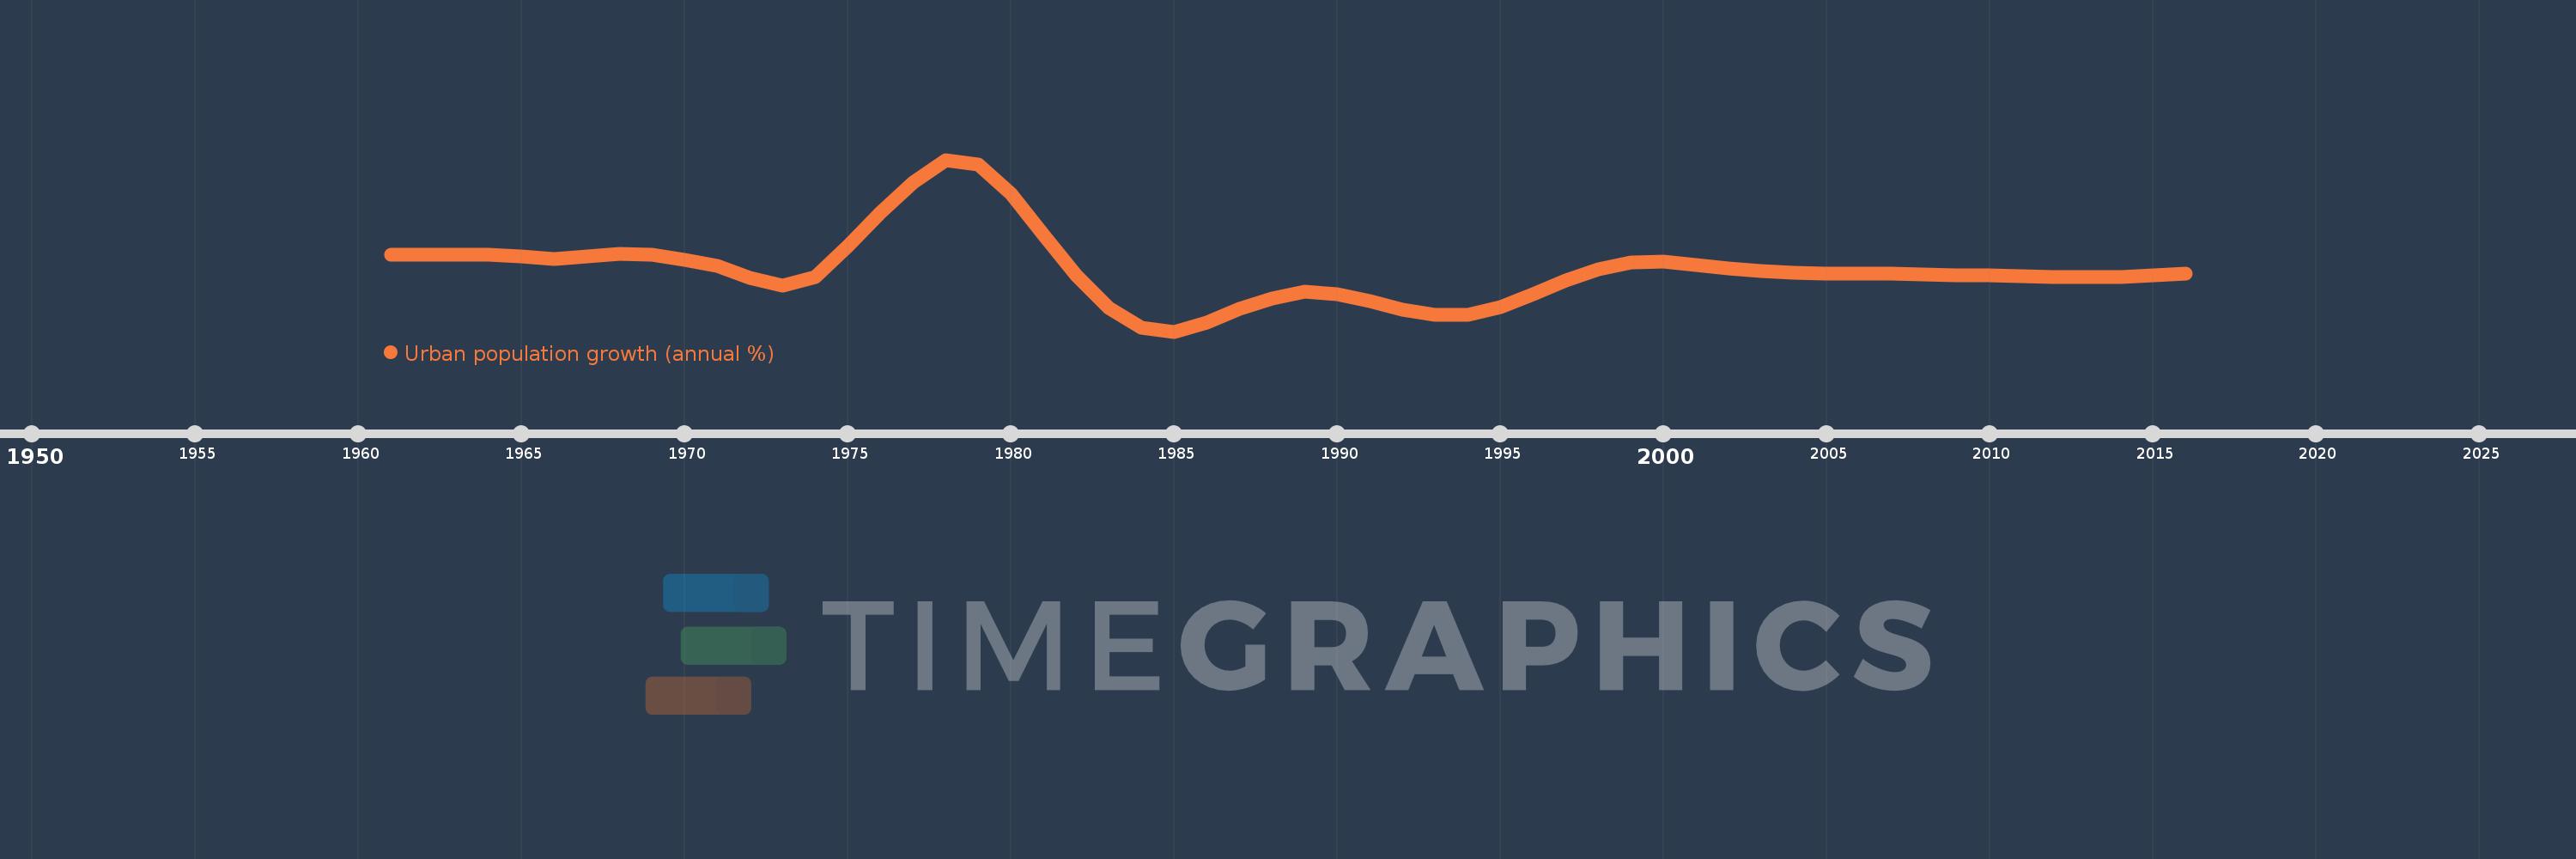
En esta escala de tiempo se presenta un gráfico de 1961 y 2016 de Somalia. Los datos de 1960 están ausentes. El número de observaciones reales por fecha: 56.
Fuente (nombre):
Indicadores del desarrollo mundial
Fuente (organización):
World Bank Staff estimates based on United Nations, World Urbanization Prospects.
Categorías:
Climate Change, Urban Development
Se ha actualizado:
23 abr 2017 año
Los indicadores de los cambios de valor en los últimos años
Mínimo:
-0.453
1 ene 1985 año
Máximo:
11.954
1 ene 1978 año
A la fecha de observación
Valor
Cambio absoluto
El cambio con respecto al valor anterior
1 ene 1961 año
5.072
+5.072
0.0%
1 ene 1962 año
5.069
-0.003
-0.05%
1 ene 1963 año
5.085
+0.015
0.3%
1 ene 1964 año
5.087
+0.002
0.04%
1 ene 1965 año
4.961
-0.126
-2.48%
1 ene 1966 año
4.813
-0.148
-2.98%
1 ene 1967 año
4.99
+0.177
3.68%
1 ene 1968 año
5.174
+0.184
3.69%
1 ene 1969 año
5.116
-0.058
-1.12%
1 ene 1970 año
4.747
-0.369
-7.21%
1 ene 1971 año
4.271
-0.476
-10.03%
1 ene 1972 año
3.424
-0.847
-19.83%
1 ene 1973 año
2.846
-0.578
-16.88%
1 ene 1974 año
3.486
+0.64
22.49%
1 ene 1975 año
5.731
+2.245
64.4%
1 ene 1976 año
8.137
+2.406
41.98%
1 ene 1977 año
10.286
+2.149
26.41%
1 ene 1978 año
11.954
+1.668
16.21%
1 ene 1979 año
11.63
-0.323
-2.7%
1 ene 1980 año
9.479
-2.152
-18.5%
1 ene 1981 año
6.545
-2.933
-30.95%
1 ene 1982 año
3.585
-2.96
-45.23%
1 ene 1983 año
1.27
-2.315
-64.57%
1 ene 1984 año
-0.2
-1.471
-115.77%
1 ene 1985 año
-0.453
-0.253
126.2%
1 ene 1986 año
0.205
+0.659
-145.33%
1 ene 1987 año
1.179
+0.973
473.62%
1 ene 1988 año
1.952
+0.773
65.6%
1 ene 1989 año
2.457
+0.505
25.89%
1 ene 1990 año
2.267
-0.19
-7.74%
1 ene 1991 año
1.747
-0.52
-22.93%
1 ene 1992 año
1.137
-0.61
-34.93%
1 ene 1993 año
0.762
-0.375
-33.0%
1 ene 1994 año
0.758
-0.003
-0.43%
1 ene 1995 año
1.307
+0.548
72.27%
1 ene 1996 año
2.216
+0.909
69.57%
1 ene 1997 año
3.235
+1.02
46.03%
1 ene 1998 año
4.05
+0.815
25.19%
1 ene 1999 año
4.536
+0.485
11.98%
1 ene 2000 año
4.598
+0.062
1.37%
1 ene 2001 año
4.378
-0.22
-4.79%
1 ene 2002 año
4.103
-0.275
-6.28%
1 ene 2003 año
3.917
-0.186
-4.54%
1 ene 2004 año
3.786
-0.131
-3.34%
1 ene 2005 año
3.728
-0.058
-1.54%
1 ene 2006 año
3.716
-0.012
-0.33%
1 ene 2007 año
3.711
-0.005
-0.14%
1 ene 2008 año
3.679
-0.032
-0.85%
1 ene 2009 año
3.639
-0.04
-1.08%
1 ene 2010 año
3.598
-0.042
-1.15%
1 ene 2011 año
3.552
-0.045
-1.26%
1 ene 2012 año
3.503
-0.05
-1.39%
1 ene 2013 año
3.477
-0.026
-0.73%
1 ene 2014 año
3.506
+0.029
0.84%
1 ene 2015 año
3.6
+0.093
2.66%
1 ene 2016 año
3.734
+0.134
3.72%
Ranking de los países por los datos estadísticos actuales


Comentarios: