29
/es/
es
AIzaSyAYiBZKx7MnpbEhh9jyipgxe19OcubqV5w
April 1, 2024
220360
Papua New Guinea
PNG
true
2
1
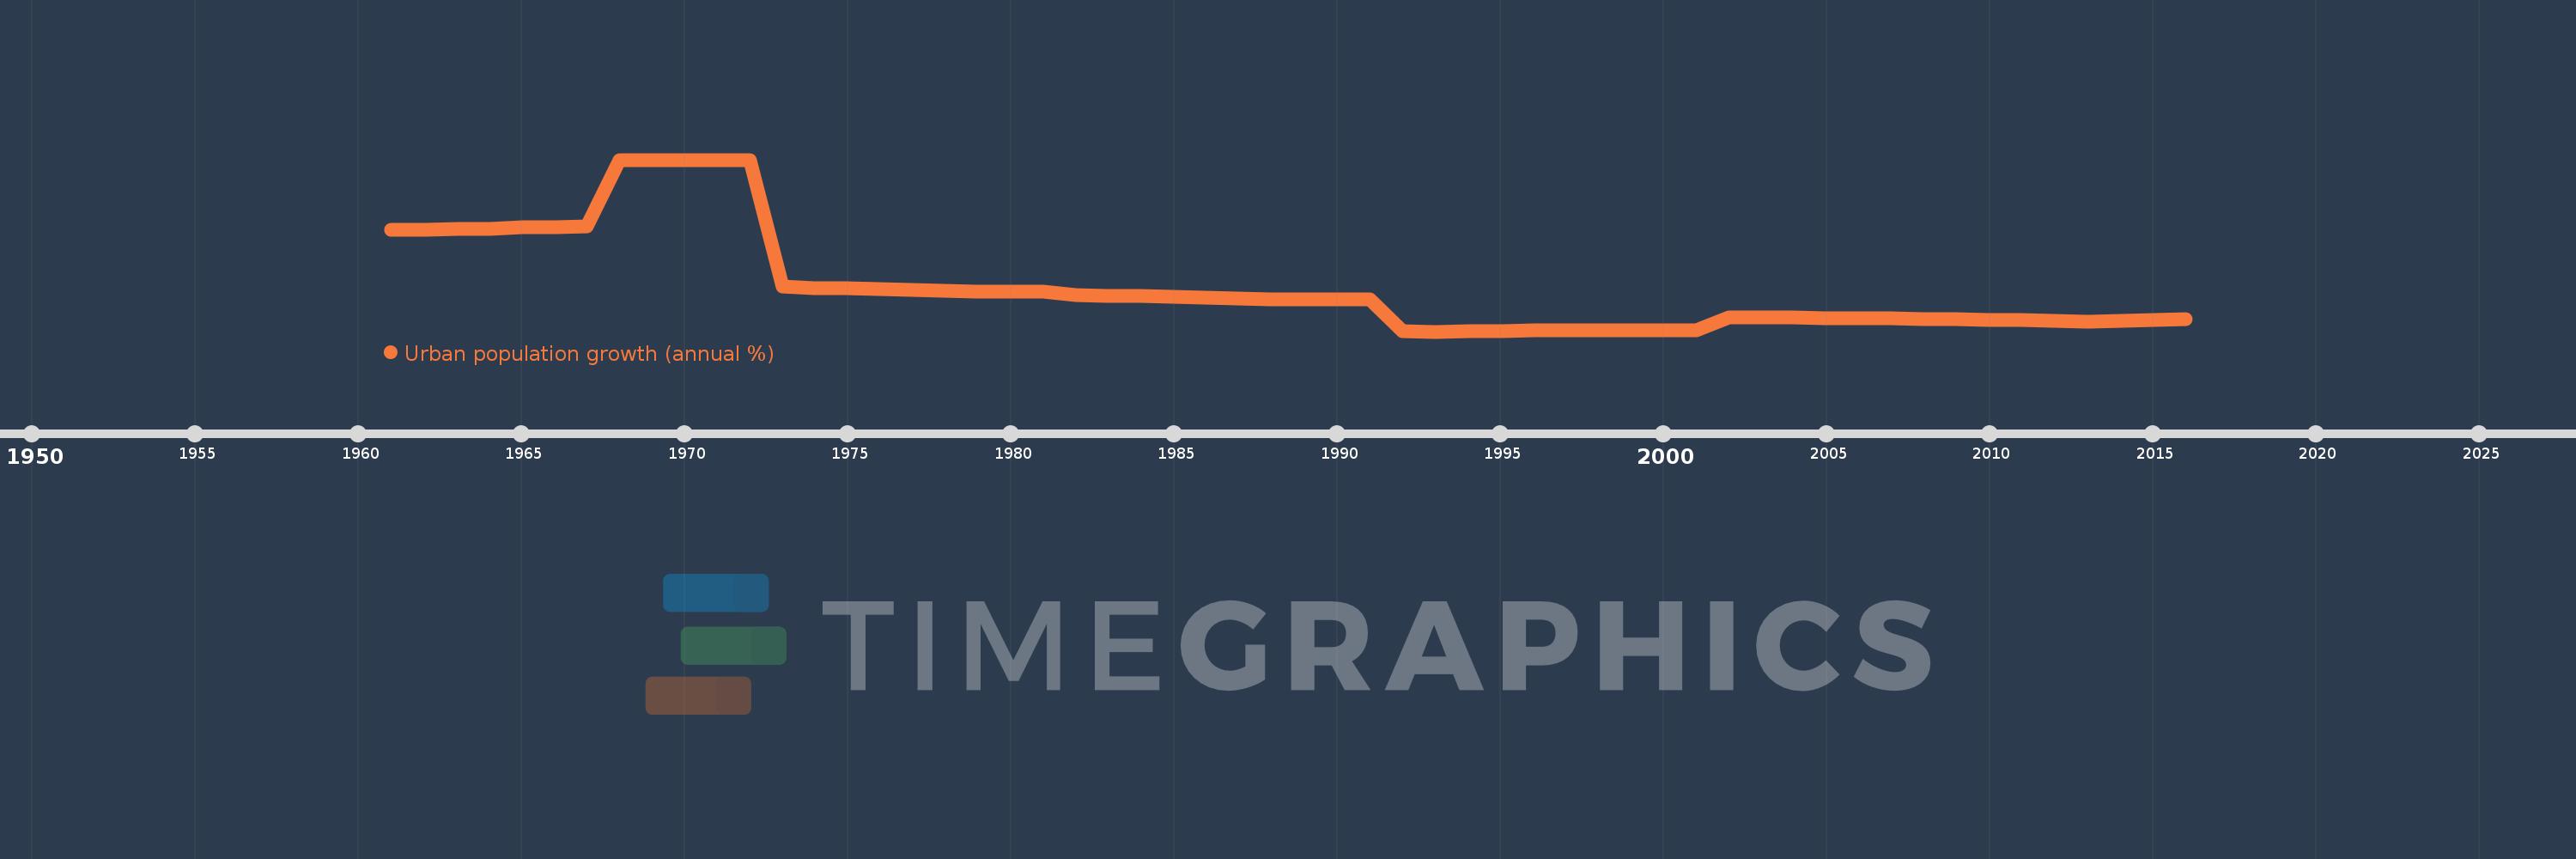
Urban population growth (annual %)
2016,2015,2014,2013,2012,2011,2010,2009,2008,2007,2006,2005,2004,2003,2002,2001,2000,1999,1998,1997,1996,1995,1994,1993,1992,1991,1990,1989,1988,1987,1986,1985,1984,1983,1982,1981,1980,1979,1978,1977,1976,1975,1974,1973,1972,1971,1970,1969,1968,1967,1966,1965,1964,1963,1962,1961
Estas estadísticas en otros países:
AfghanistanAlbaniaAlgeriaAmerican SamoaAndorraAngolaAntigua and BarbudaArab WorldArgentinaArmeniaArubaAustraliaAustriaAzerbaijanBahamas, TheBahrainBangladeshBarbadosBelarusBelgiumBelizeBeninBermudaBhutanBoliviaBosnia and HerzegovinaBotswanaBrazilBritish Virgin IslandsBrunei DarussalamBulgariaBurkina FasoBurundiCabo VerdeCambodiaCameroonCanadaCaribbean small statesCayman IslandsCentral African RepublicCentral Europe and the BalticsChadChannel IslandsChileChinaColombiaComorosCongo, Dem. Rep.Congo, Rep.Costa RicaCote d'IvoireCroatiaCubaCuracaoCyprusCzech RepublicDenmarkDjiboutiDominicaDominican RepublicEarly-demographic dividendEast Asia & PacificEast Asia & Pacific (excluding high income)East Asia & Pacific (IDA & IBRD countries)EcuadorEgypt, Arab Rep.El SalvadorEquatorial GuineaEritreaEstoniaEthiopiaEuro areaEurope & Central AsiaEurope & Central Asia (excluding high income)Europe & Central Asia (IDA & IBRD countries)European UnionFaroe IslandsFijiFinlandFragile and conflict affected situationsFranceFrench PolynesiaGabonGambia, TheGeorgiaGermanyGhanaGibraltarGreeceGreenlandGrenadaGuamGuatemalaGuineaGuinea-BissauGuyanaHaitiHeavily indebted poor countries (HIPC)High incomeHondurasHong Kong SAR, ChinaHungaryIBRD onlyIcelandIDA & IBRD totalIDA blendIDA onlyIDA totalIndiaIndonesiaIran, Islamic Rep.IraqIrelandIsle of ManIsraelItalyJamaicaJapanJordanKazakhstanKenyaKiribatiKorea, Dem. People’s Rep.Korea, Rep.KuwaitKyrgyz RepublicLao PDRLate-demographic dividendLatin America & Caribbean Latin America & Caribbean (excluding high income)Latin America & the Caribbean (IDA & IBRD countries)LatviaLeast developed countries: UN classificationLebanonLesothoLiberiaLibyaLiechtensteinLithuaniaLow & middle incomeLow incomeLower middle incomeLuxembourgMacao SAR, ChinaMacedonia, FYRMadagascarMalawiMalaysiaMaldivesMaliMaltaMarshall IslandsMauritaniaMauritiusMexicoMicronesia, Fed. Sts.Middle East & North AfricaMiddle East & North Africa (excluding high income)Middle East & North Africa (IDA & IBRD countries)Middle incomeMoldovaMonacoMongoliaMontenegroMoroccoMozambiqueMyanmarNamibiaNauruNepalNetherlandsNew CaledoniaNew ZealandNicaraguaNigerNigeriaNorth AmericaNorthern Mariana IslandsNorwayOECD membersOmanOther small statesPacific island small statesPakistanPalauPanamaPapua New GuineaParaguayPeruPhilippinesPolandPortugalPost-demographic dividendPre-demographic dividendPuerto RicoQatarRomaniaRussian FederationRwandaSamoaSan MarinoSao Tome and PrincipeSaudi ArabiaSenegalSerbiaSeychellesSierra LeoneSingaporeSint Maarten (Dutch part)Slovak RepublicSloveniaSmall statesSolomon IslandsSomaliaSouth AfricaSouth AsiaSouth Asia (IDA & IBRD)South SudanSpainSri LankaSt. Kitts and NevisSt. LuciaSt. Vincent and the GrenadinesSub-Saharan Africa Sub-Saharan Africa (excluding high income)Sub-Saharan Africa (IDA & IBRD countries)SudanSurinameSwazilandSwedenSwitzerlandSyrian Arab RepublicTajikistanTanzaniaThailandTimor-LesteTogoTongaTrinidad and TobagoTunisiaTurkeyTurkmenistanTurks and Caicos IslandsTuvaluUgandaUkraineUnited Arab EmiratesUnited KingdomUnited StatesUpper middle incomeUruguayUzbekistanVanuatuVenezuela, RBVietnamVirgin Islands (U.S.)West Bank and GazaWorldYemen, Rep.ZambiaZimbabwe línea de tiempo (timeline):
En esta escala de tiempo se presenta un gráfico de 1961 y 2016 de Papua New Guinea. Los datos de 1960 están ausentes. El número de observaciones reales por fecha: 56.
Fuente (nombre):
Indicadores del desarrollo mundial
Fuente (organización):
World Bank Staff estimates based on United Nations, World Urbanization Prospects.
Categorías:
Climate Change, Urban Development
Se ha actualizado:
23 abr 2017 año
Los indicadores de los cambios de valor en los últimos años
Mínimo:
1.22
1 ene 1993 año
Máximo:
15.122
1 ene 1969 año
A la fecha de observación
Valor
Cambio absoluto
El cambio con respecto al valor anterior
1 ene 1961 año
9.44
+9.44
0.0%
1 ene 1962 año
9.439
0.0
0.0%
1 ene 1963 año
9.51
+0.071
0.75%
1 ene 1964 año
9.55
+0.039
0.41%
1 ene 1965 año
9.651
+0.101
1.06%
1 ene 1966 año
9.683
+0.032
0.33%
1 ene 1967 año
9.767
+0.084
0.87%
1 ene 1968 año
15.12
+5.352
54.8%
1 ene 1969 año
15.122
+0.002
0.02%
1 ene 1970 año
15.098
-0.024
-0.16%
1 ene 1971 año
15.085
-0.013
-0.09%
1 ene 1972 año
15.066
-0.019
-0.13%
1 ene 1973 año
4.86
-10.206
-67.74%
1 ene 1974 año
4.741
-0.118
-2.44%
1 ene 1975 año
4.717
-0.024
-0.52%
1 ene 1976 año
4.647
-0.069
-1.47%
1 ene 1977 año
4.569
-0.078
-1.68%
1 ene 1978 año
4.489
-0.08
-1.76%
1 ene 1979 año
4.46
-0.029
-0.64%
1 ene 1980 año
4.453
-0.007
-0.15%
1 ene 1981 año
4.469
+0.016
0.35%
1 ene 1982 año
4.205
-0.264
-5.91%
1 ene 1983 año
4.13
-0.075
-1.79%
1 ene 1984 año
4.109
-0.02
-0.49%
1 ene 1985 año
4.053
-0.057
-1.38%
1 ene 1986 año
3.974
-0.078
-1.93%
1 ene 1987 año
3.9
-0.074
-1.87%
1 ene 1988 año
3.836
-0.064
-1.65%
1 ene 1989 año
3.797
-0.038
-0.99%
1 ene 1990 año
3.799
+0.001
0.04%
1 ene 1991 año
3.81
+0.011
0.29%
1 ene 1992 año
1.277
-2.533
-66.48%
1 ene 1993 año
1.22
-0.057
-4.43%
1 ene 1994 año
1.249
+0.029
2.37%
1 ene 1995 año
1.269
+0.02
1.56%
1 ene 1996 año
1.296
+0.027
2.14%
1 ene 1997 año
1.317
+0.021
1.61%
1 ene 1998 año
1.345
+0.028
2.12%
1 ene 1999 año
1.349
+0.004
0.29%
1 ene 2000 año
1.324
-0.025
-1.85%
1 ene 2001 año
1.299
-0.024
-1.84%
1 ene 2002 año
2.383
+1.084
83.4%
1 ene 2003 año
2.379
-0.004
-0.16%
1 ene 2004 año
2.349
-0.03
-1.26%
1 ene 2005 año
2.318
-0.031
-1.33%
1 ene 2006 año
2.305
-0.013
-0.55%
1 ene 2007 año
2.285
-0.02
-0.87%
1 ene 2008 año
2.26
-0.025
-1.1%
1 ene 2009 año
2.226
-0.034
-1.49%
1 ene 2010 año
2.182
-0.044
-1.97%
1 ene 2011 año
2.132
-0.05
-2.3%
1 ene 2012 año
2.073
-0.059
-2.77%
1 ene 2013 año
2.033
-0.04
-1.93%
1 ene 2014 año
2.091
+0.058
2.85%
1 ene 2015 año
2.156
+0.065
3.13%
1 ene 2016 año
2.219
+0.063
2.92%
Ranking de los países por los datos estadísticos actuales


Comentarios: