29
/es/
es
AIzaSyAYiBZKx7MnpbEhh9jyipgxe19OcubqV5w
April 1, 2024
217870
Palau
PLW
true
2
1
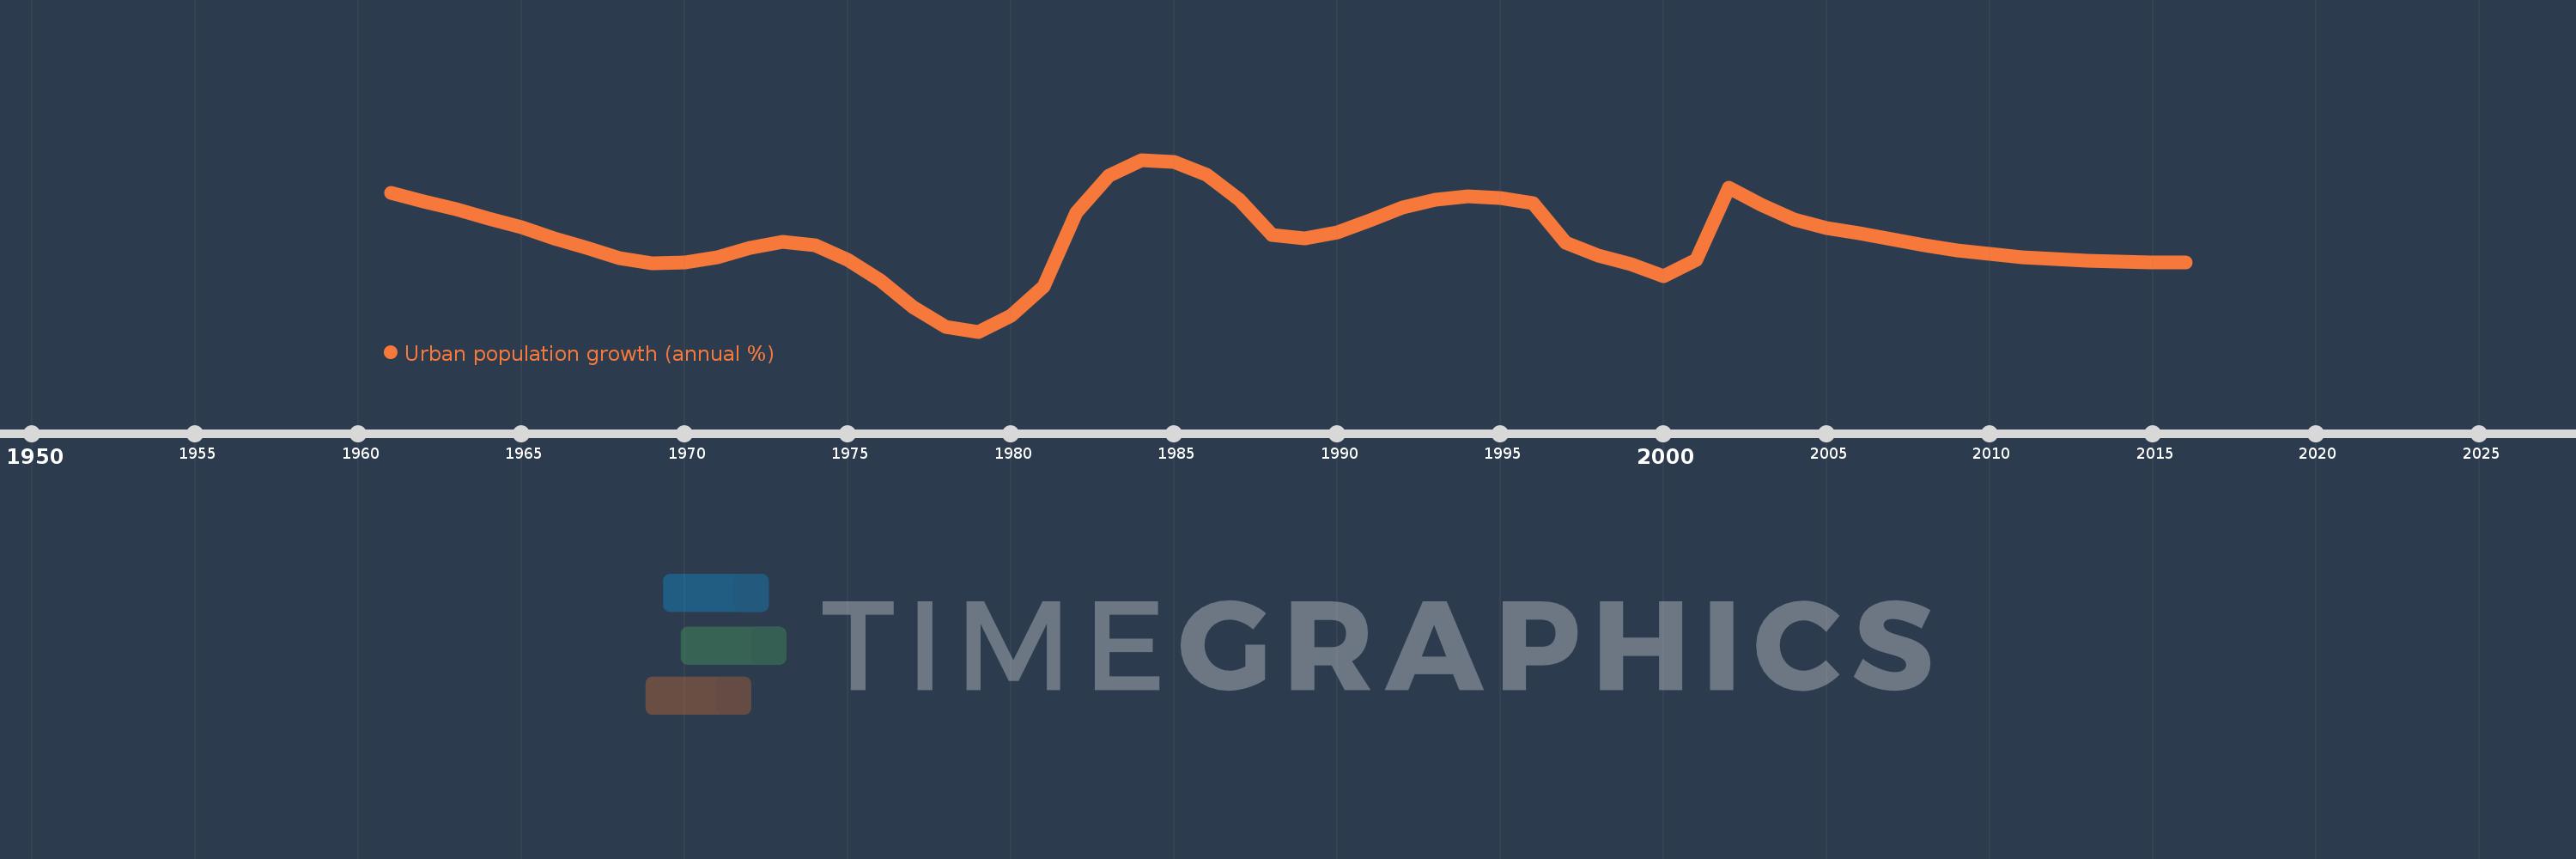
Urban population growth (annual %)
2016,2015,2014,2013,2012,2011,2010,2009,2008,2007,2006,2005,2004,2003,2002,2001,2000,1999,1998,1997,1996,1995,1994,1993,1992,1991,1990,1989,1988,1987,1986,1985,1984,1983,1982,1981,1980,1979,1978,1977,1976,1975,1974,1973,1972,1971,1970,1969,1968,1967,1966,1965,1964,1963,1962,1961
Estas estadísticas en otros países:
AfghanistanAlbaniaAlgeriaAmerican SamoaAndorraAngolaAntigua and BarbudaArab WorldArgentinaArmeniaArubaAustraliaAustriaAzerbaijanBahamas, TheBahrainBangladeshBarbadosBelarusBelgiumBelizeBeninBermudaBhutanBoliviaBosnia and HerzegovinaBotswanaBrazilBritish Virgin IslandsBrunei DarussalamBulgariaBurkina FasoBurundiCabo VerdeCambodiaCameroonCanadaCaribbean small statesCayman IslandsCentral African RepublicCentral Europe and the BalticsChadChannel IslandsChileChinaColombiaComorosCongo, Dem. Rep.Congo, Rep.Costa RicaCote d'IvoireCroatiaCubaCuracaoCyprusCzech RepublicDenmarkDjiboutiDominicaDominican RepublicEarly-demographic dividendEast Asia & PacificEast Asia & Pacific (excluding high income)East Asia & Pacific (IDA & IBRD countries)EcuadorEgypt, Arab Rep.El SalvadorEquatorial GuineaEritreaEstoniaEthiopiaEuro areaEurope & Central AsiaEurope & Central Asia (excluding high income)Europe & Central Asia (IDA & IBRD countries)European UnionFaroe IslandsFijiFinlandFragile and conflict affected situationsFranceFrench PolynesiaGabonGambia, TheGeorgiaGermanyGhanaGibraltarGreeceGreenlandGrenadaGuamGuatemalaGuineaGuinea-BissauGuyanaHaitiHeavily indebted poor countries (HIPC)High incomeHondurasHong Kong SAR, ChinaHungaryIBRD onlyIcelandIDA & IBRD totalIDA blendIDA onlyIDA totalIndiaIndonesiaIran, Islamic Rep.IraqIrelandIsle of ManIsraelItalyJamaicaJapanJordanKazakhstanKenyaKiribatiKorea, Dem. People’s Rep.Korea, Rep.KuwaitKyrgyz RepublicLao PDRLate-demographic dividendLatin America & Caribbean Latin America & Caribbean (excluding high income)Latin America & the Caribbean (IDA & IBRD countries)LatviaLeast developed countries: UN classificationLebanonLesothoLiberiaLibyaLiechtensteinLithuaniaLow & middle incomeLow incomeLower middle incomeLuxembourgMacao SAR, ChinaMacedonia, FYRMadagascarMalawiMalaysiaMaldivesMaliMaltaMarshall IslandsMauritaniaMauritiusMexicoMicronesia, Fed. Sts.Middle East & North AfricaMiddle East & North Africa (excluding high income)Middle East & North Africa (IDA & IBRD countries)Middle incomeMoldovaMonacoMongoliaMontenegroMoroccoMozambiqueMyanmarNamibiaNauruNepalNetherlandsNew CaledoniaNew ZealandNicaraguaNigerNigeriaNorth AmericaNorthern Mariana IslandsNorwayOECD membersOmanOther small statesPacific island small statesPakistanPalauPanamaPapua New GuineaParaguayPeruPhilippinesPolandPortugalPost-demographic dividendPre-demographic dividendPuerto RicoQatarRomaniaRussian FederationRwandaSamoaSan MarinoSao Tome and PrincipeSaudi ArabiaSenegalSerbiaSeychellesSierra LeoneSingaporeSint Maarten (Dutch part)Slovak RepublicSloveniaSmall statesSolomon IslandsSomaliaSouth AfricaSouth AsiaSouth Asia (IDA & IBRD)South SudanSpainSri LankaSt. Kitts and NevisSt. LuciaSt. Vincent and the GrenadinesSub-Saharan Africa Sub-Saharan Africa (excluding high income)Sub-Saharan Africa (IDA & IBRD countries)SudanSurinameSwazilandSwedenSwitzerlandSyrian Arab RepublicTajikistanTanzaniaThailandTimor-LesteTogoTongaTrinidad and TobagoTunisiaTurkeyTurkmenistanTurks and Caicos IslandsTuvaluUgandaUkraineUnited Arab EmiratesUnited KingdomUnited StatesUpper middle incomeUruguayUzbekistanVanuatuVenezuela, RBVietnamVirgin Islands (U.S.)West Bank and GazaWorldYemen, Rep.ZambiaZimbabwe línea de tiempo (timeline):
En esta escala de tiempo se presenta un gráfico de 1961 y 2016 de Palau. Los datos de 1960 están ausentes. El número de observaciones reales por fecha: 56.
Fuente (nombre):
Indicadores del desarrollo mundial
Fuente (organización):
World Bank Staff estimates based on United Nations, World Urbanization Prospects.
Categorías:
Climate Change, Urban Development
Se ha actualizado:
23 abr 2017 año
Los indicadores de los cambios de valor en los últimos años
Mínimo:
-0.146
1 ene 1979 año
Máximo:
4.259
1 ene 1984 año
A la fecha de observación
Valor
Cambio absoluto
El cambio con respecto al valor anterior
1 ene 1961 año
3.417
+3.417
0.0%
1 ene 1962 año
3.198
-0.219
-6.41%
1 ene 1963 año
2.996
-0.202
-6.32%
1 ene 1964 año
2.742
-0.254
-8.48%
1 ene 1965 año
2.539
-0.203
-7.42%
1 ene 1966 año
2.253
-0.285
-11.24%
1 ene 1967 año
2.001
-0.252
-11.19%
1 ene 1968 año
1.732
-0.269
-13.44%
1 ene 1969 año
1.597
-0.135
-7.8%
1 ene 1970 año
1.631
+0.034
2.15%
1 ene 1971 año
1.766
+0.134
8.24%
1 ene 1972 año
1.993
+0.227
12.86%
1 ene 1973 año
2.15
+0.157
7.89%
1 ene 1974 año
2.077
-0.073
-3.38%
1 ene 1975 año
1.699
-0.379
-18.22%
1 ene 1976 año
1.166
-0.533
-31.39%
1 ene 1977 año
0.492
-0.674
-57.82%
1 ene 1978 año
-0.027
-0.518
-105.39%
1 ene 1979 año
-0.146
-0.119
450.47%
1 ene 1980 año
0.252
+0.398
-272.64%
1 ene 1981 año
1.015
+0.763
302.7%
1 ene 1982 año
2.894
+1.88
185.27%
1 ene 1983 año
3.848
+0.953
32.94%
1 ene 1984 año
4.259
+0.411
10.68%
1 ene 1985 año
4.197
-0.061
-1.44%
1 ene 1986 año
3.866
-0.331
-7.9%
1 ene 1987 año
3.241
-0.625
-16.17%
1 ene 1988 año
2.322
-0.918
-28.34%
1 ene 1989 año
2.24
-0.083
-3.56%
1 ene 1990 año
2.396
+0.157
6.99%
1 ene 1991 año
2.703
+0.306
12.79%
1 ene 1992 año
3.03
+0.327
12.1%
1 ene 1993 año
3.227
+0.198
6.52%
1 ene 1994 año
3.325
+0.098
3.05%
1 ene 1995 año
3.285
-0.04
-1.2%
1 ene 1996 año
3.148
-0.137
-4.17%
1 ene 1997 año
2.135
-1.013
-32.18%
1 ene 1998 año
1.795
-0.341
-15.95%
1 ene 1999 año
1.579
-0.216
-12.02%
1 ene 2000 año
1.274
-0.305
-19.3%
1 ene 2001 año
1.691
+0.417
32.75%
1 ene 2002 año
3.537
+1.846
109.12%
1 ene 2003 año
3.103
-0.434
-12.28%
1 ene 2004 año
2.725
-0.378
-12.18%
1 ene 2005 año
2.507
-0.218
-7.99%
1 ene 2006 año
2.368
-0.139
-5.54%
1 ene 2007 año
2.212
-0.156
-6.58%
1 ene 2008 año
2.059
-0.153
-6.92%
1 ene 2009 año
1.933
-0.127
-6.15%
1 ene 2010 año
1.842
-0.09
-4.67%
1 ene 2011 año
1.768
-0.074
-4.04%
1 ene 2012 año
1.708
-0.06
-3.37%
1 ene 2013 año
1.68
-0.029
-1.68%
1 ene 2014 año
1.641
-0.039
-2.32%
1 ene 2015 año
1.636
-0.005
-0.28%
1 ene 2016 año
1.626
-0.01
-0.62%
Ranking de los países por los datos estadísticos actuales


Comentarios: