29
/es/
es
AIzaSyAYiBZKx7MnpbEhh9jyipgxe19OcubqV5w
April 1, 2024
24019
Arab World
ARB
false
2
1
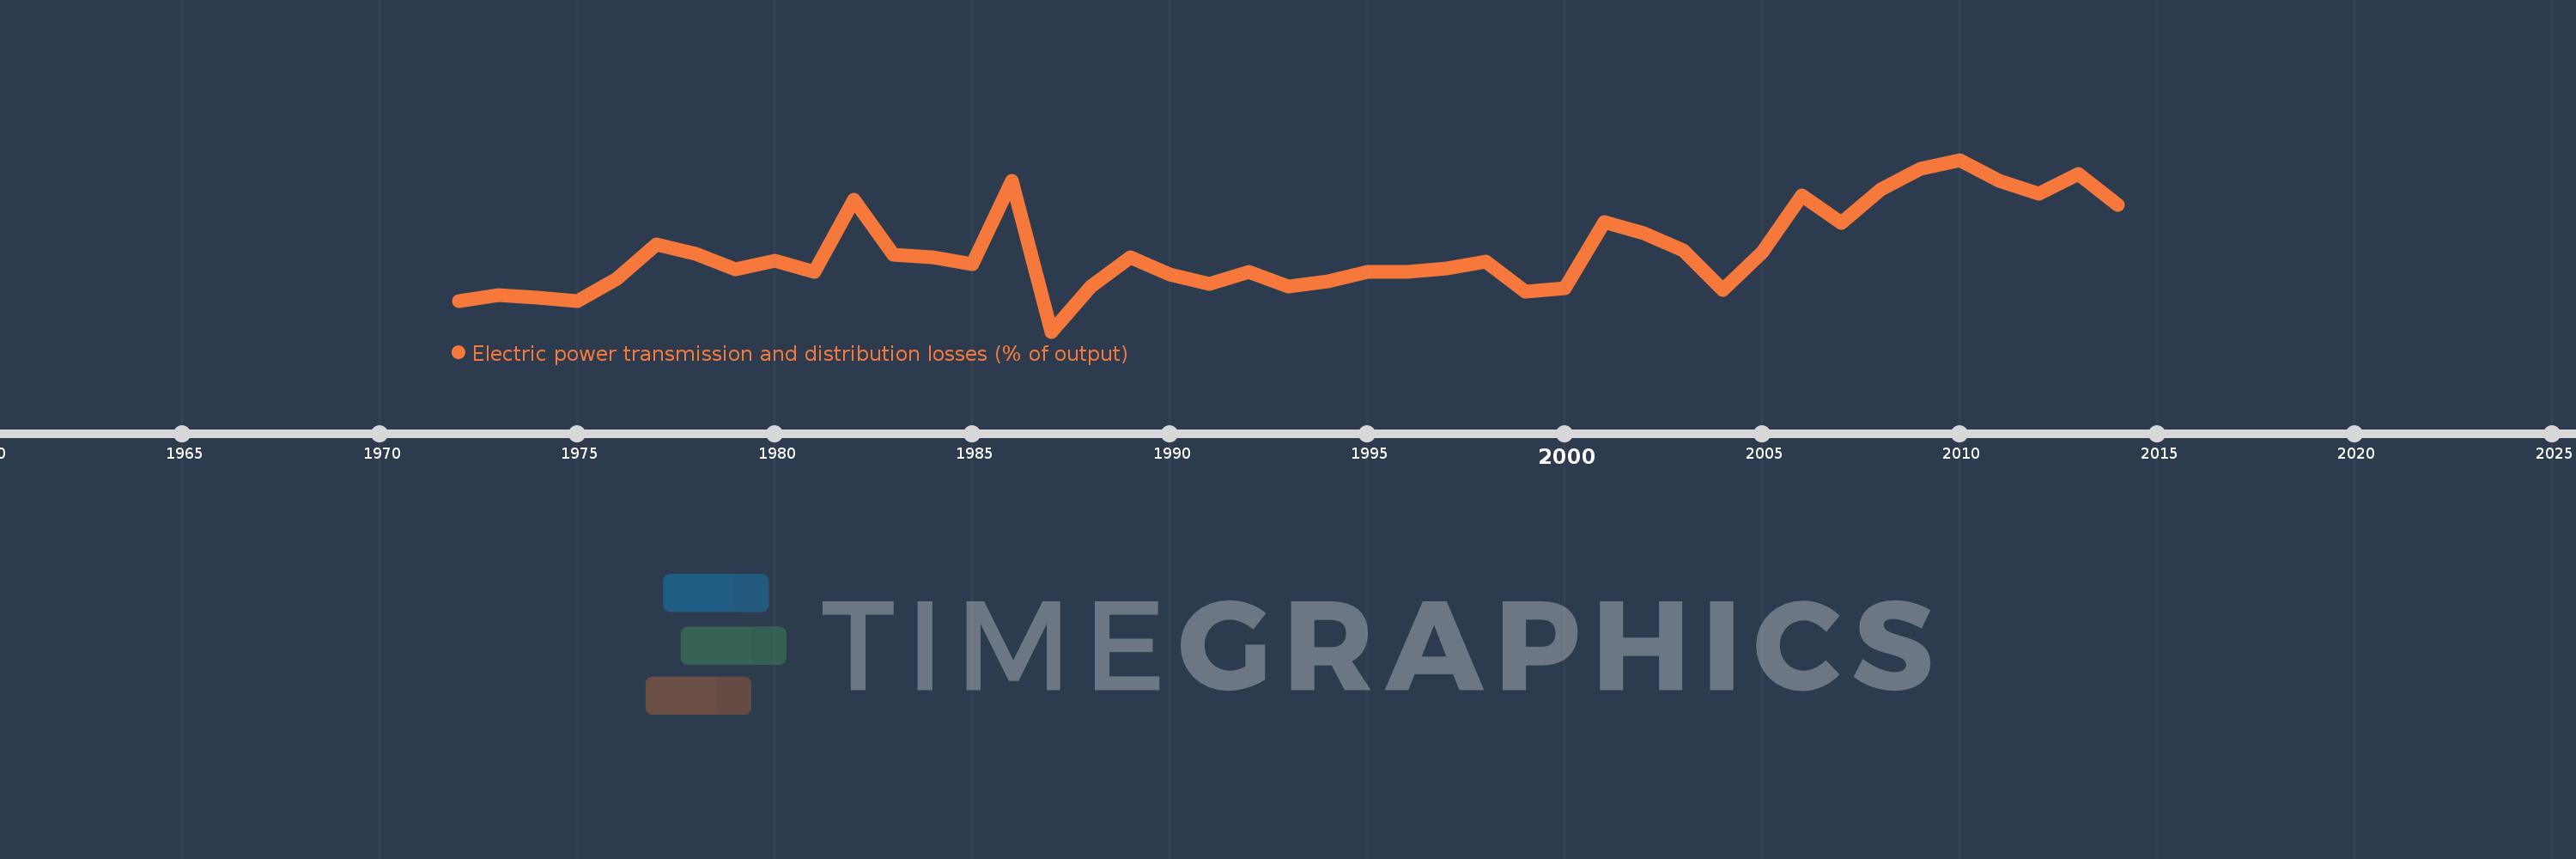
Electric power transmission and distribution losses (% of output)
2014,2013,2012,2011,2010,2009,2008,2007,2006,2005,2004,2003,2002,2001,2000,1999,1998,1997,1996,1995,1994,1993,1992,1991,1990,1989,1988,1987,1986,1985,1984,1983,1982,1981,1980,1979,1978,1977,1976,1975,1974,1973,1972
Estas estadísticas en otros países:
AlbaniaAlgeriaAngolaArab WorldArgentinaArmeniaAustraliaAustriaAzerbaijanBahrainBangladeshBelarusBelgiumBeninBoliviaBosnia and HerzegovinaBotswanaBrazilBrunei DarussalamBulgariaCambodiaCameroonCanadaCaribbean small statesCentral Europe and the BalticsChileChinaColombiaCongo, Dem. Rep.Congo, Rep.Costa RicaCote d'IvoireCroatiaCubaCuracaoCyprusCzech RepublicDenmarkDominican RepublicEarly-demographic dividendEast Asia & PacificEast Asia & Pacific (excluding high income)East Asia & Pacific (IDA & IBRD countries)EcuadorEgypt, Arab Rep.El SalvadorEritreaEstoniaEthiopiaEuro areaEurope & Central AsiaEurope & Central Asia (excluding high income)Europe & Central Asia (IDA & IBRD countries)European UnionFinlandFragile and conflict affected situationsFranceGabonGeorgiaGermanyGhanaGibraltarGreeceGuatemalaHaitiHeavily indebted poor countries (HIPC)High incomeHondurasHong Kong SAR, ChinaHungaryIBRD onlyIcelandIDA & IBRD totalIDA blendIDA onlyIDA totalIndiaIndonesiaIran, Islamic Rep.IraqIrelandIsraelItalyJamaicaJapanJordanKazakhstanKenyaKorea, Dem. People’s Rep.Korea, Rep.KosovoKuwaitKyrgyz RepublicLate-demographic dividendLatin America & Caribbean Latin America & Caribbean (excluding high income)Latin America & the Caribbean (IDA & IBRD countries)LatviaLeast developed countries: UN classificationLebanonLibyaLithuaniaLow & middle incomeLow incomeLower middle incomeLuxembourgMacedonia, FYRMalaysiaMaltaMauritiusMexicoMiddle East & North AfricaMiddle East & North Africa (excluding high income)Middle East & North Africa (IDA & IBRD countries)Middle incomeMoldovaMongoliaMontenegroMoroccoMozambiqueMyanmarNamibiaNepalNetherlandsNew ZealandNicaraguaNigerNigeriaNorth AmericaNorwayOECD membersOmanOther small statesPakistanPanamaParaguayPeruPhilippinesPolandPortugalPost-demographic dividendPre-demographic dividendQatarRomaniaRussian FederationSaudi ArabiaSenegalSerbiaSingaporeSlovak RepublicSloveniaSmall statesSouth AfricaSouth AsiaSouth Asia (IDA & IBRD)South SudanSpainSri LankaSub-Saharan Africa Sub-Saharan Africa (excluding high income)Sub-Saharan Africa (IDA & IBRD countries)SudanSwedenSwitzerlandSyrian Arab RepublicTajikistanTanzaniaThailandTogoTrinidad and TobagoTunisiaTurkeyTurkmenistanUkraineUnited Arab EmiratesUnited KingdomUnited StatesUpper middle incomeUruguayUzbekistanVenezuela, RBVietnamWorldYemen, Rep.ZambiaZimbabwe línea de tiempo (timeline):
En esta escala de tiempo se presenta un gráfico de 1972 y 2014 de Arab World. Los datos de 1971 están ausentes. El número de observaciones reales por fecha: 43.
Fuente (nombre):
Indicadores del desarrollo mundial
Fuente (organización):
IEA Statistics © OECD/IEA 2014 (http://www.iea.org/stats/index.asp), subject to https://www.iea.org/t&c/termsandconditions/
Categorías:
Energy & Mining, Infrastructure
Se ha actualizado:
23 abr 2017 año
Los indicadores de los cambios de valor en los últimos años
Mínimo:
8.199
1 ene 1987 año
Máximo:
13.24
1 ene 2010 año
A la fecha de observación
Valor
Cambio absoluto
El cambio con respecto al valor anterior
1 ene 1972 año
9.098
+9.098
0.0%
1 ene 1973 año
9.262
+0.164
1.8%
1 ene 1974 año
9.193
-0.069
-0.74%
1 ene 1975 año
9.088
-0.105
-1.14%
1 ene 1976 año
9.739
+0.651
7.17%
1 ene 1977 año
10.762
+1.023
10.5%
1 ene 1978 año
10.491
-0.271
-2.52%
1 ene 1979 año
10.024
-0.467
-4.46%
1 ene 1980 año
10.277
+0.253
2.53%
1 ene 1981 año
9.944
-0.333
-3.24%
1 ene 1982 año
12.07
+2.126
21.38%
1 ene 1983 año
10.457
-1.613
-13.36%
1 ene 1984 año
10.373
-0.084
-0.8%
1 ene 1985 año
10.178
-0.195
-1.88%
1 ene 1986 año
12.611
+2.433
23.91%
1 ene 1987 año
8.199
-4.413
-34.99%
1 ene 1988 año
9.522
+1.323
16.13%
1 ene 1989 año
10.375
+0.854
8.97%
1 ene 1990 año
9.885
-0.49
-4.72%
1 ene 1991 año
9.595
-0.29
-2.94%
1 ene 1992 año
9.947
+0.351
3.66%
1 ene 1993 año
9.529
-0.418
-4.2%
1 ene 1994 año
9.662
+0.133
1.4%
1 ene 1995 año
9.944
+0.282
2.92%
1 ene 1996 año
9.953
+0.009
0.09%
1 ene 1997 año
10.053
+0.1
1.0%
1 ene 1998 año
10.246
+0.193
1.92%
1 ene 1999 año
9.379
-0.866
-8.46%
1 ene 2000 año
9.462
+0.083
0.89%
1 ene 2001 año
11.417
+1.955
20.66%
1 ene 2002 año
11.075
-0.342
-2.99%
1 ene 2003 año
10.575
-0.5
-4.52%
1 ene 2004 año
9.428
-1.147
-10.85%
1 ene 2005 año
10.525
+1.096
11.63%
1 ene 2006 año
12.194
+1.669
15.86%
1 ene 2007 año
11.382
-0.812
-6.66%
1 ene 2008 año
12.359
+0.978
8.59%
1 ene 2009 año
12.979
+0.62
5.01%
1 ene 2010 año
13.24
+0.261
2.01%
1 ene 2011 año
12.633
-0.607
-4.59%
1 ene 2012 año
12.232
-0.401
-3.17%
1 ene 2013 año
12.832
+0.6
4.9%
1 ene 2014 año
11.908
-0.923
-7.2%
Ranking de los países por los datos estadísticos actuales


Comentarios: