29
/es/
es
AIzaSyAYiBZKx7MnpbEhh9jyipgxe19OcubqV5w
April 1, 2024
140259
Ghana
GHA
true
2
1
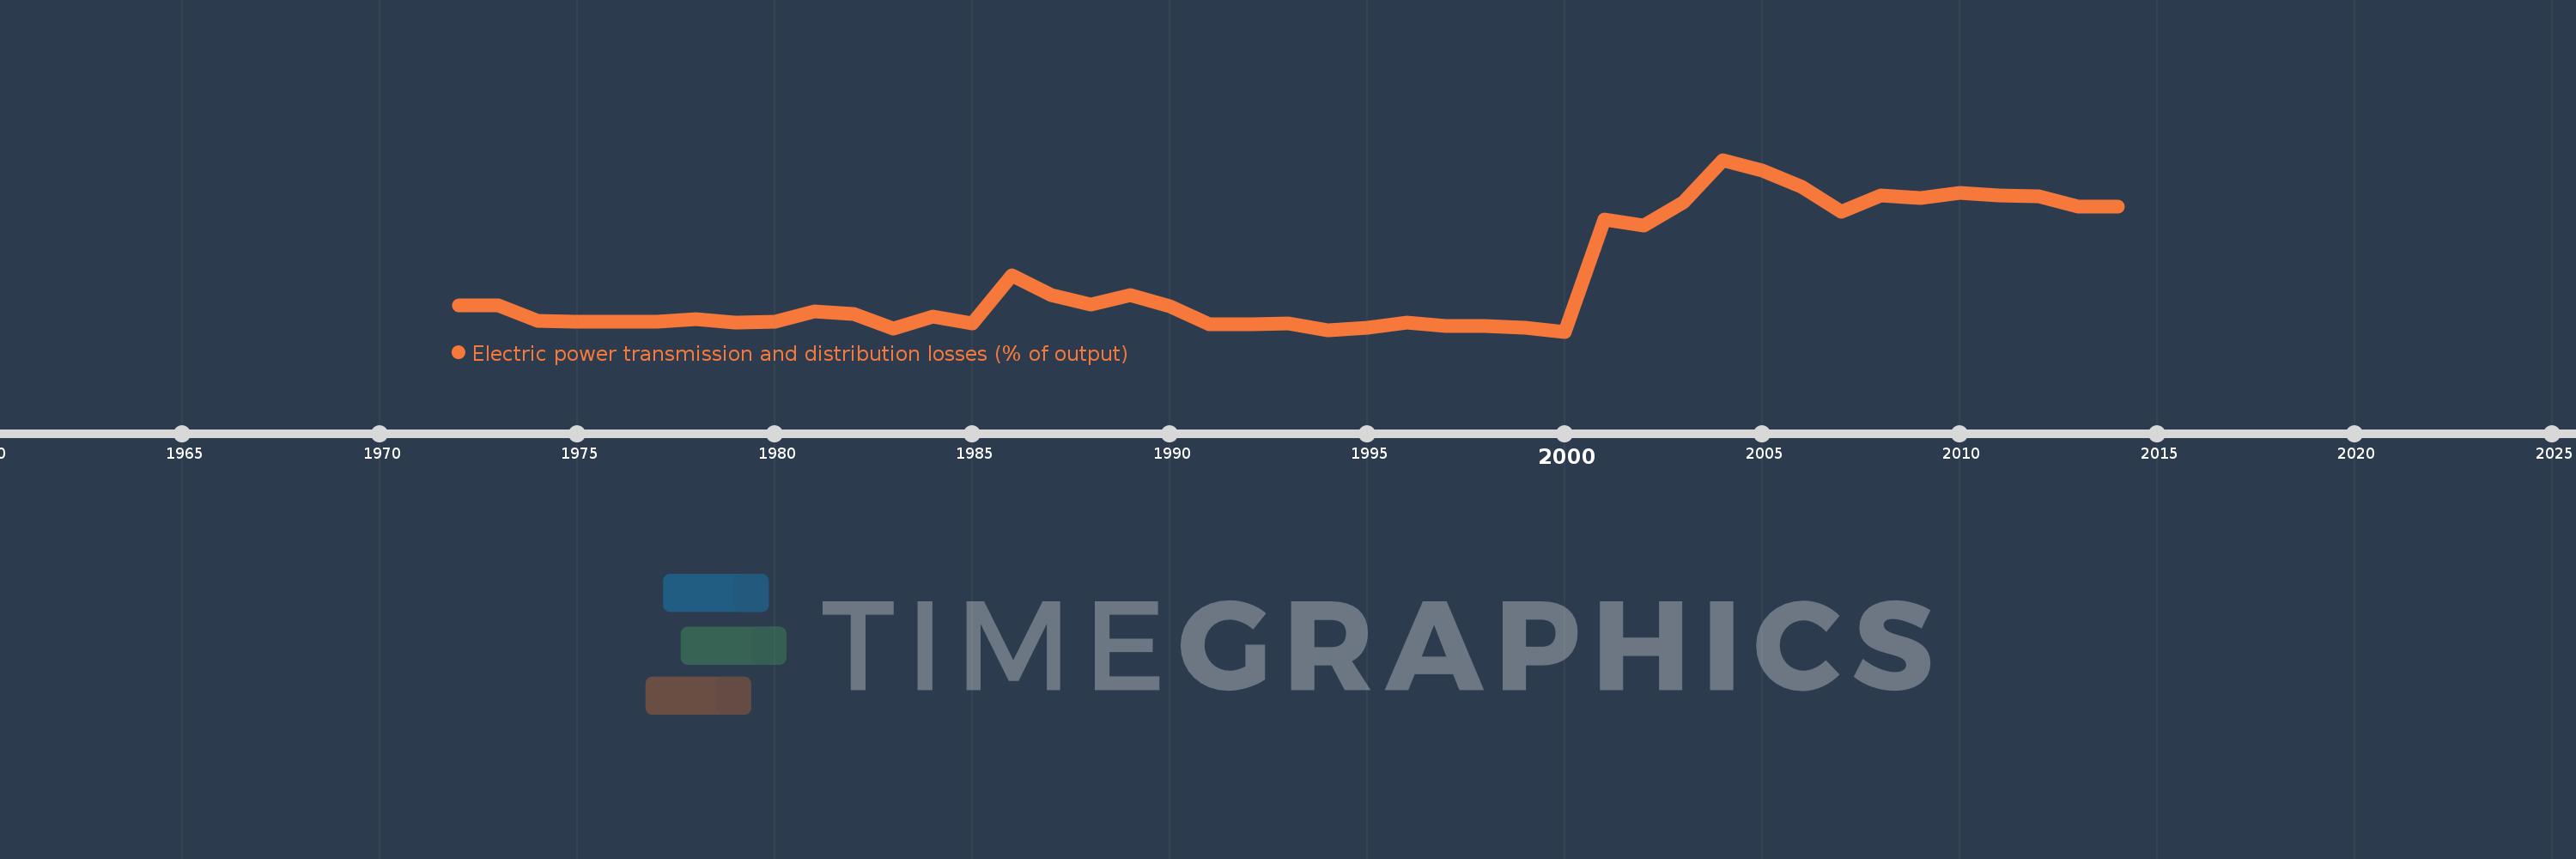
Electric power transmission and distribution losses (% of output)
2014,2013,2012,2011,2010,2009,2008,2007,2006,2005,2004,2003,2002,2001,2000,1999,1998,1997,1996,1995,1994,1993,1992,1991,1990,1989,1988,1987,1986,1985,1984,1983,1982,1981,1980,1979,1978,1977,1976,1975,1974,1973,1972
Estas estadísticas en otros países:
AlbaniaAlgeriaAngolaArab WorldArgentinaArmeniaAustraliaAustriaAzerbaijanBahrainBangladeshBelarusBelgiumBeninBoliviaBosnia and HerzegovinaBotswanaBrazilBrunei DarussalamBulgariaCambodiaCameroonCanadaCaribbean small statesCentral Europe and the BalticsChileChinaColombiaCongo, Dem. Rep.Congo, Rep.Costa RicaCote d'IvoireCroatiaCubaCuracaoCyprusCzech RepublicDenmarkDominican RepublicEarly-demographic dividendEast Asia & PacificEast Asia & Pacific (excluding high income)East Asia & Pacific (IDA & IBRD countries)EcuadorEgypt, Arab Rep.El SalvadorEritreaEstoniaEthiopiaEuro areaEurope & Central AsiaEurope & Central Asia (excluding high income)Europe & Central Asia (IDA & IBRD countries)European UnionFinlandFragile and conflict affected situationsFranceGabonGeorgiaGermanyGhanaGibraltarGreeceGuatemalaHaitiHeavily indebted poor countries (HIPC)High incomeHondurasHong Kong SAR, ChinaHungaryIBRD onlyIcelandIDA & IBRD totalIDA blendIDA onlyIDA totalIndiaIndonesiaIran, Islamic Rep.IraqIrelandIsraelItalyJamaicaJapanJordanKazakhstanKenyaKorea, Dem. People’s Rep.Korea, Rep.KosovoKuwaitKyrgyz RepublicLate-demographic dividendLatin America & Caribbean Latin America & Caribbean (excluding high income)Latin America & the Caribbean (IDA & IBRD countries)LatviaLeast developed countries: UN classificationLebanonLibyaLithuaniaLow & middle incomeLow incomeLower middle incomeLuxembourgMacedonia, FYRMalaysiaMaltaMauritiusMexicoMiddle East & North AfricaMiddle East & North Africa (excluding high income)Middle East & North Africa (IDA & IBRD countries)Middle incomeMoldovaMongoliaMontenegroMoroccoMozambiqueMyanmarNamibiaNepalNetherlandsNew ZealandNicaraguaNigerNigeriaNorth AmericaNorwayOECD membersOmanOther small statesPakistanPanamaParaguayPeruPhilippinesPolandPortugalPost-demographic dividendPre-demographic dividendQatarRomaniaRussian FederationSaudi ArabiaSenegalSerbiaSingaporeSlovak RepublicSloveniaSmall statesSouth AfricaSouth AsiaSouth Asia (IDA & IBRD)South SudanSpainSri LankaSub-Saharan Africa Sub-Saharan Africa (excluding high income)Sub-Saharan Africa (IDA & IBRD countries)SudanSwedenSwitzerlandSyrian Arab RepublicTajikistanTanzaniaThailandTogoTrinidad and TobagoTunisiaTurkeyTurkmenistanUkraineUnited Arab EmiratesUnited KingdomUnited StatesUpper middle incomeUruguayUzbekistanVenezuela, RBVietnamWorldYemen, Rep.ZambiaZimbabwe línea de tiempo (timeline):
En esta escala de tiempo se presenta un gráfico de 1972 y 2014 de Ghana. Los datos de 1971 están ausentes. El número de observaciones reales por fecha: 43.
Fuente (nombre):
Indicadores del desarrollo mundial
Fuente (organización):
IEA Statistics © OECD/IEA 2014 (http://www.iea.org/stats/index.asp), subject to https://www.iea.org/t&c/termsandconditions/
Categorías:
Energy & Mining, Infrastructure
Se ha actualizado:
23 abr 2017 año
Los indicadores de los cambios de valor en los últimos años
Mínimo:
1.989
1 ene 2000 año
Máximo:
28.834
1 ene 2004 año
A la fecha de observación
Valor
Cambio absoluto
El cambio con respecto al valor anterior
1 ene 1972 año
6.114
+6.114
0.0%
1 ene 1973 año
6.136
+0.022
0.36%
1 ene 1974 año
3.632
-2.505
-40.82%
1 ene 1975 año
3.505
-0.127
-3.5%
1 ene 1976 año
3.536
+0.031
0.89%
1 ene 1977 año
3.53
-0.006
-0.16%
1 ene 1978 año
3.937
+0.407
11.53%
1 ene 1979 año
3.366
-0.571
-14.5%
1 ene 1980 año
3.587
+0.221
6.56%
1 ene 1981 año
5.191
+1.604
44.73%
1 ene 1982 año
4.688
-0.503
-9.7%
1 ene 1983 año
2.435
-2.252
-48.05%
1 ene 1984 año
4.316
+1.881
77.23%
1 ene 1985 año
3.221
-1.095
-25.38%
1 ene 1986 año
10.736
+7.515
233.35%
1 ene 1987 año
7.724
-3.012
-28.05%
1 ene 1988 año
6.223
-1.5
-19.43%
1 ene 1989 año
7.716
+1.493
23.99%
1 ene 1990 año
6.003
-1.714
-22.21%
1 ene 1991 año
3.146
-2.856
-47.58%
1 ene 1992 año
3.176
+0.029
0.93%
1 ene 1993 año
3.272
+0.096
3.03%
1 ene 1994 año
2.138
-1.133
-34.64%
1 ene 1995 año
2.553
+0.415
19.39%
1 ene 1996 año
3.336
+0.782
30.64%
1 ene 1997 año
2.852
-0.484
-14.5%
1 ene 1998 año
2.861
+0.009
0.31%
1 ene 1999 año
2.591
-0.27
-9.43%
1 ene 2000 año
1.989
-0.602
-23.24%
1 ene 2001 año
19.479
+17.49
879.36%
1 ene 2002 año
18.565
-0.915
-4.7%
1 ene 2003 año
22.164
+3.599
19.39%
1 ene 2004 año
28.834
+6.67
30.09%
1 ene 2005 año
27.124
-1.71
-5.93%
1 ene 2006 año
24.573
-2.551
-9.4%
1 ene 2007 año
20.676
-3.897
-15.86%
1 ene 2008 año
23.302
+2.626
12.7%
1 ene 2009 año
22.874
-0.428
-1.84%
1 ene 2010 año
23.633
+0.759
3.32%
1 ene 2011 año
23.222
-0.41
-1.74%
1 ene 2012 año
23.116
-0.106
-0.46%
1 ene 2013 año
21.532
-1.584
-6.85%
1 ene 2014 año
21.545
+0.013
0.06%
Ranking de los países por los datos estadísticos actuales


Comentarios: