29
/es/
es
AIzaSyAYiBZKx7MnpbEhh9jyipgxe19OcubqV5w
April 1, 2024
216298
Pakistan
PAK
true
2
1
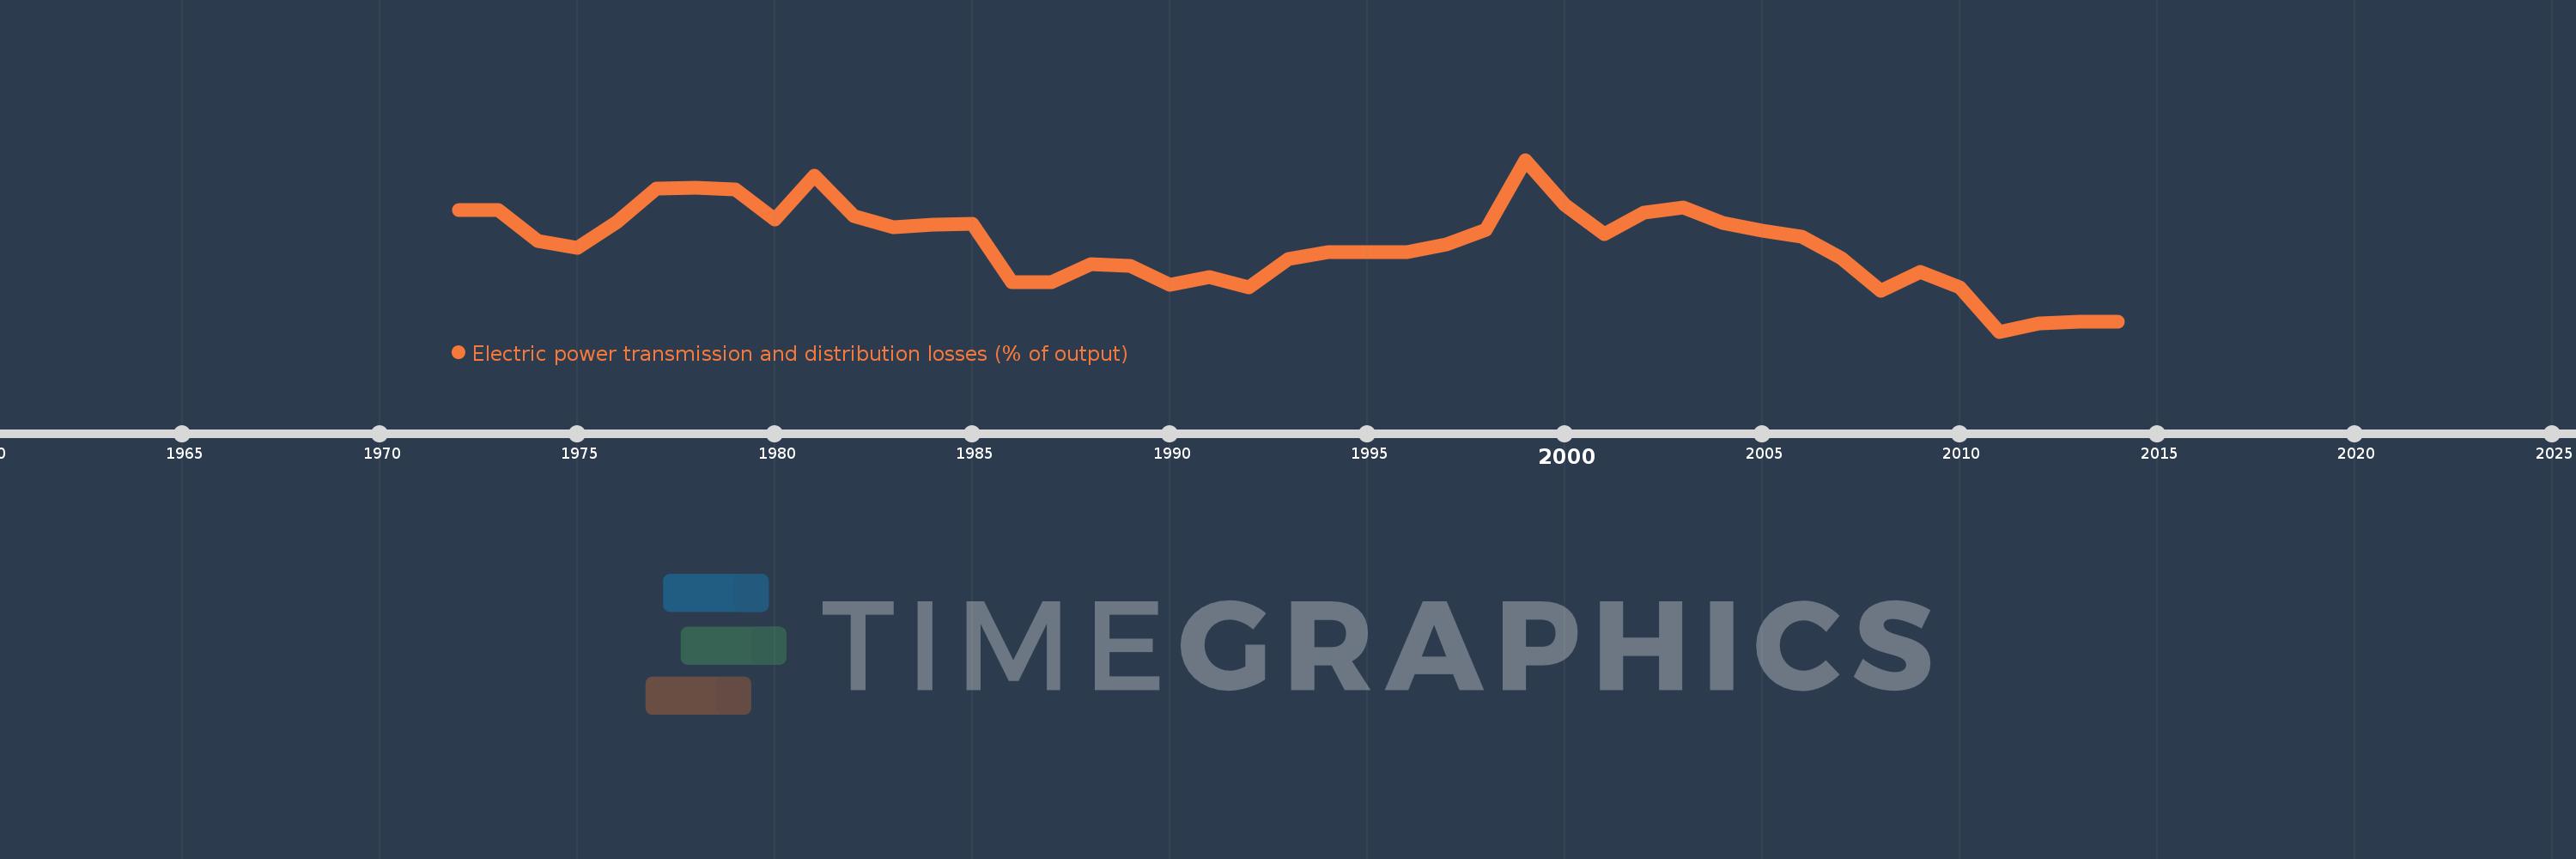
Electric power transmission and distribution losses (% of output)
2014,2013,2012,2011,2010,2009,2008,2007,2006,2005,2004,2003,2002,2001,2000,1999,1998,1997,1996,1995,1994,1993,1992,1991,1990,1989,1988,1987,1986,1985,1984,1983,1982,1981,1980,1979,1978,1977,1976,1975,1974,1973,1972
Estas estadísticas en otros países:
AlbaniaAlgeriaAngolaArab WorldArgentinaArmeniaAustraliaAustriaAzerbaijanBahrainBangladeshBelarusBelgiumBeninBoliviaBosnia and HerzegovinaBotswanaBrazilBrunei DarussalamBulgariaCambodiaCameroonCanadaCaribbean small statesCentral Europe and the BalticsChileChinaColombiaCongo, Dem. Rep.Congo, Rep.Costa RicaCote d'IvoireCroatiaCubaCuracaoCyprusCzech RepublicDenmarkDominican RepublicEarly-demographic dividendEast Asia & PacificEast Asia & Pacific (excluding high income)East Asia & Pacific (IDA & IBRD countries)EcuadorEgypt, Arab Rep.El SalvadorEritreaEstoniaEthiopiaEuro areaEurope & Central AsiaEurope & Central Asia (excluding high income)Europe & Central Asia (IDA & IBRD countries)European UnionFinlandFragile and conflict affected situationsFranceGabonGeorgiaGermanyGhanaGibraltarGreeceGuatemalaHaitiHeavily indebted poor countries (HIPC)High incomeHondurasHong Kong SAR, ChinaHungaryIBRD onlyIcelandIDA & IBRD totalIDA blendIDA onlyIDA totalIndiaIndonesiaIran, Islamic Rep.IraqIrelandIsraelItalyJamaicaJapanJordanKazakhstanKenyaKorea, Dem. People’s Rep.Korea, Rep.KosovoKuwaitKyrgyz RepublicLate-demographic dividendLatin America & Caribbean Latin America & Caribbean (excluding high income)Latin America & the Caribbean (IDA & IBRD countries)LatviaLeast developed countries: UN classificationLebanonLibyaLithuaniaLow & middle incomeLow incomeLower middle incomeLuxembourgMacedonia, FYRMalaysiaMaltaMauritiusMexicoMiddle East & North AfricaMiddle East & North Africa (excluding high income)Middle East & North Africa (IDA & IBRD countries)Middle incomeMoldovaMongoliaMontenegroMoroccoMozambiqueMyanmarNamibiaNepalNetherlandsNew ZealandNicaraguaNigerNigeriaNorth AmericaNorwayOECD membersOmanOther small statesPakistanPanamaParaguayPeruPhilippinesPolandPortugalPost-demographic dividendPre-demographic dividendQatarRomaniaRussian FederationSaudi ArabiaSenegalSerbiaSingaporeSlovak RepublicSloveniaSmall statesSouth AfricaSouth AsiaSouth Asia (IDA & IBRD)South SudanSpainSri LankaSub-Saharan Africa Sub-Saharan Africa (excluding high income)Sub-Saharan Africa (IDA & IBRD countries)SudanSwedenSwitzerlandSyrian Arab RepublicTajikistanTanzaniaThailandTogoTrinidad and TobagoTunisiaTurkeyTurkmenistanUkraineUnited Arab EmiratesUnited KingdomUnited StatesUpper middle incomeUruguayUzbekistanVenezuela, RBVietnamWorldYemen, Rep.ZambiaZimbabwe línea de tiempo (timeline):
En esta escala de tiempo se presenta un gráfico de 1972 y 2014 de Pakistan. Los datos de 1971 están ausentes. El número de observaciones reales por fecha: 43.
Fuente (nombre):
Indicadores del desarrollo mundial
Fuente (organización):
IEA Statistics © OECD/IEA 2014 (http://www.iea.org/stats/index.asp), subject to https://www.iea.org/t&c/termsandconditions/
Categorías:
Energy & Mining, Infrastructure
Se ha actualizado:
23 abr 2017 año
Los indicadores de los cambios de valor en los últimos años
Mínimo:
16.226
1 ene 2011 año
Máximo:
30.414
1 ene 1999 año
A la fecha de observación
Valor
Cambio absoluto
El cambio con respecto al valor anterior
1 ene 1972 año
26.255
+26.255
0.0%
1 ene 1973 año
26.255
0.0
0.0%
1 ene 1974 año
23.732
-2.523
-9.61%
1 ene 1975 año
23.158
-0.574
-2.42%
1 ene 1976 año
25.259
+2.101
9.07%
1 ene 1977 año
28.023
+2.764
10.94%
1 ene 1978 año
28.105
+0.082
0.29%
1 ene 1979 año
27.976
-0.129
-0.46%
1 ene 1980 año
25.455
-2.521
-9.01%
1 ene 1981 año
29.084
+3.629
14.26%
1 ene 1982 año
25.794
-3.29
-11.31%
1 ene 1983 año
24.864
-0.929
-3.6%
1 ene 1984 año
25.08
+0.216
0.87%
1 ene 1985 año
25.095
+0.015
0.06%
1 ene 1986 año
20.289
-4.806
-19.15%
1 ene 1987 año
20.286
-0.003
-0.01%
1 ene 1988 año
21.771
+1.485
7.32%
1 ene 1989 año
21.674
-0.098
-0.45%
1 ene 1990 año
20.083
-1.59
-7.34%
1 ene 1991 año
20.726
+0.642
3.2%
1 ene 1992 año
19.851
-0.875
-4.22%
1 ene 1993 año
22.19
+2.339
11.78%
1 ene 1994 año
22.799
+0.609
2.75%
1 ene 1995 año
22.764
-0.036
-0.16%
1 ene 1996 año
22.812
+0.048
0.21%
1 ene 1997 año
23.432
+0.62
2.72%
1 ene 1998 año
24.611
+1.179
5.03%
1 ene 1999 año
30.414
+5.803
23.58%
1 ene 2000 año
26.684
-3.729
-12.26%
1 ene 2001 año
24.267
-2.417
-9.06%
1 ene 2002 año
26.064
+1.796
7.4%
1 ene 2003 año
26.475
+0.412
1.58%
1 ene 2004 año
25.202
-1.273
-4.81%
1 ene 2005 año
24.568
-0.635
-2.52%
1 ene 2006 año
24.037
-0.53
-2.16%
1 ene 2007 año
22.311
-1.727
-7.18%
1 ene 2008 año
19.592
-2.719
-12.19%
1 ene 2009 año
21.171
+1.579
8.06%
1 ene 2010 año
19.88
-1.291
-6.1%
1 ene 2011 año
16.226
-3.654
-18.38%
1 ene 2012 año
16.883
+0.657
4.05%
1 ene 2013 año
17.032
+0.149
0.88%
1 ene 2014 año
17.032
+0.0
0.0%
Ranking de los países por los datos estadísticos actuales


Comentarios: