30
/es/
AIzaSyAYiBZKx7MnpbEhh9jyipgxe19OcubqV5w
April 1, 2024
240027
Sierra Leone
SLE
true
2
1
Tax revenue (current LCU)
2015,2014,2013,2012,2011,2010,2009,2008,2007,2006,2005,2004,2003,2002,2001,2000,1999,1998,1997,1996,1995,1994,1993,1992,1991
Download
Estadísticas Globales de la Biblioteca →Sierra Leone →

Tax revenue (current LCU)

Estas estadísticas en otros países:

AfghanistanAlbaniaAlgeriaAngolaAntigua and BarbudaArgentinaArmeniaAustraliaAustriaAzerbaijanBahamas, TheBahrainBangladeshBarbadosBelarusBelgiumBelizeBeninBhutanBoliviaBosnia and HerzegovinaBotswanaBrazilBulgariaBurkina FasoBurundiCabo VerdeCambodiaCanadaCentral African RepublicChileChinaColombiaCongo, Dem. Rep.Congo, Rep.Costa RicaCote d'IvoireCroatiaCyprusCzech RepublicDenmarkDominicaDominican RepublicEgypt, Arab Rep.El SalvadorEquatorial GuineaEstoniaEthiopiaFijiFinlandFranceGambia, TheGeorgiaGermanyGhanaGreeceGrenadaGuatemalaHondurasHong Kong SAR, ChinaHungaryIcelandIndiaIndonesiaIran, Islamic Rep.IraqIrelandIsraelItalyJamaicaJapanJordanKazakhstanKenyaKiribatiKorea, Rep.KuwaitKyrgyz RepublicLao PDRLatviaLebanonLesothoLiberiaLithuaniaLuxembourgMacao SAR, ChinaMacedonia, FYRMadagascarMalawiMalaysiaMaldivesMaliMaltaMauritiusMexicoMicronesia, Fed. Sts.MoldovaMongoliaMoroccoMozambiqueMyanmarNamibiaNepalNetherlandsNew ZealandNicaraguaNigeriaNorwayOmanPakistanPanamaPapua New GuineaParaguayPeruPhilippinesPolandPortugalQatarRomaniaRussian FederationRwandaSamoaSan MarinoSao Tome and PrincipeSenegalSerbiaSeychellesSierra LeoneSingaporeSlovak RepublicSloveniaSolomon IslandsSouth AfricaSpainSri LankaSt. Kitts and NevisSt. LuciaSt. Vincent and the GrenadinesSurinameSwazilandSwedenSwitzerlandSyrian Arab RepublicTajikistanTanzaniaThailandTimor-LesteTogoTrinidad and TobagoTunisiaTurkeyUgandaUkraineUnited Arab EmiratesUnited KingdomUnited StatesUruguayVanuatuVenezuela, RBVietnamWest Bank and GazaYemen, Rep.ZambiaZimbabwe

línea de tiempo (timeline):

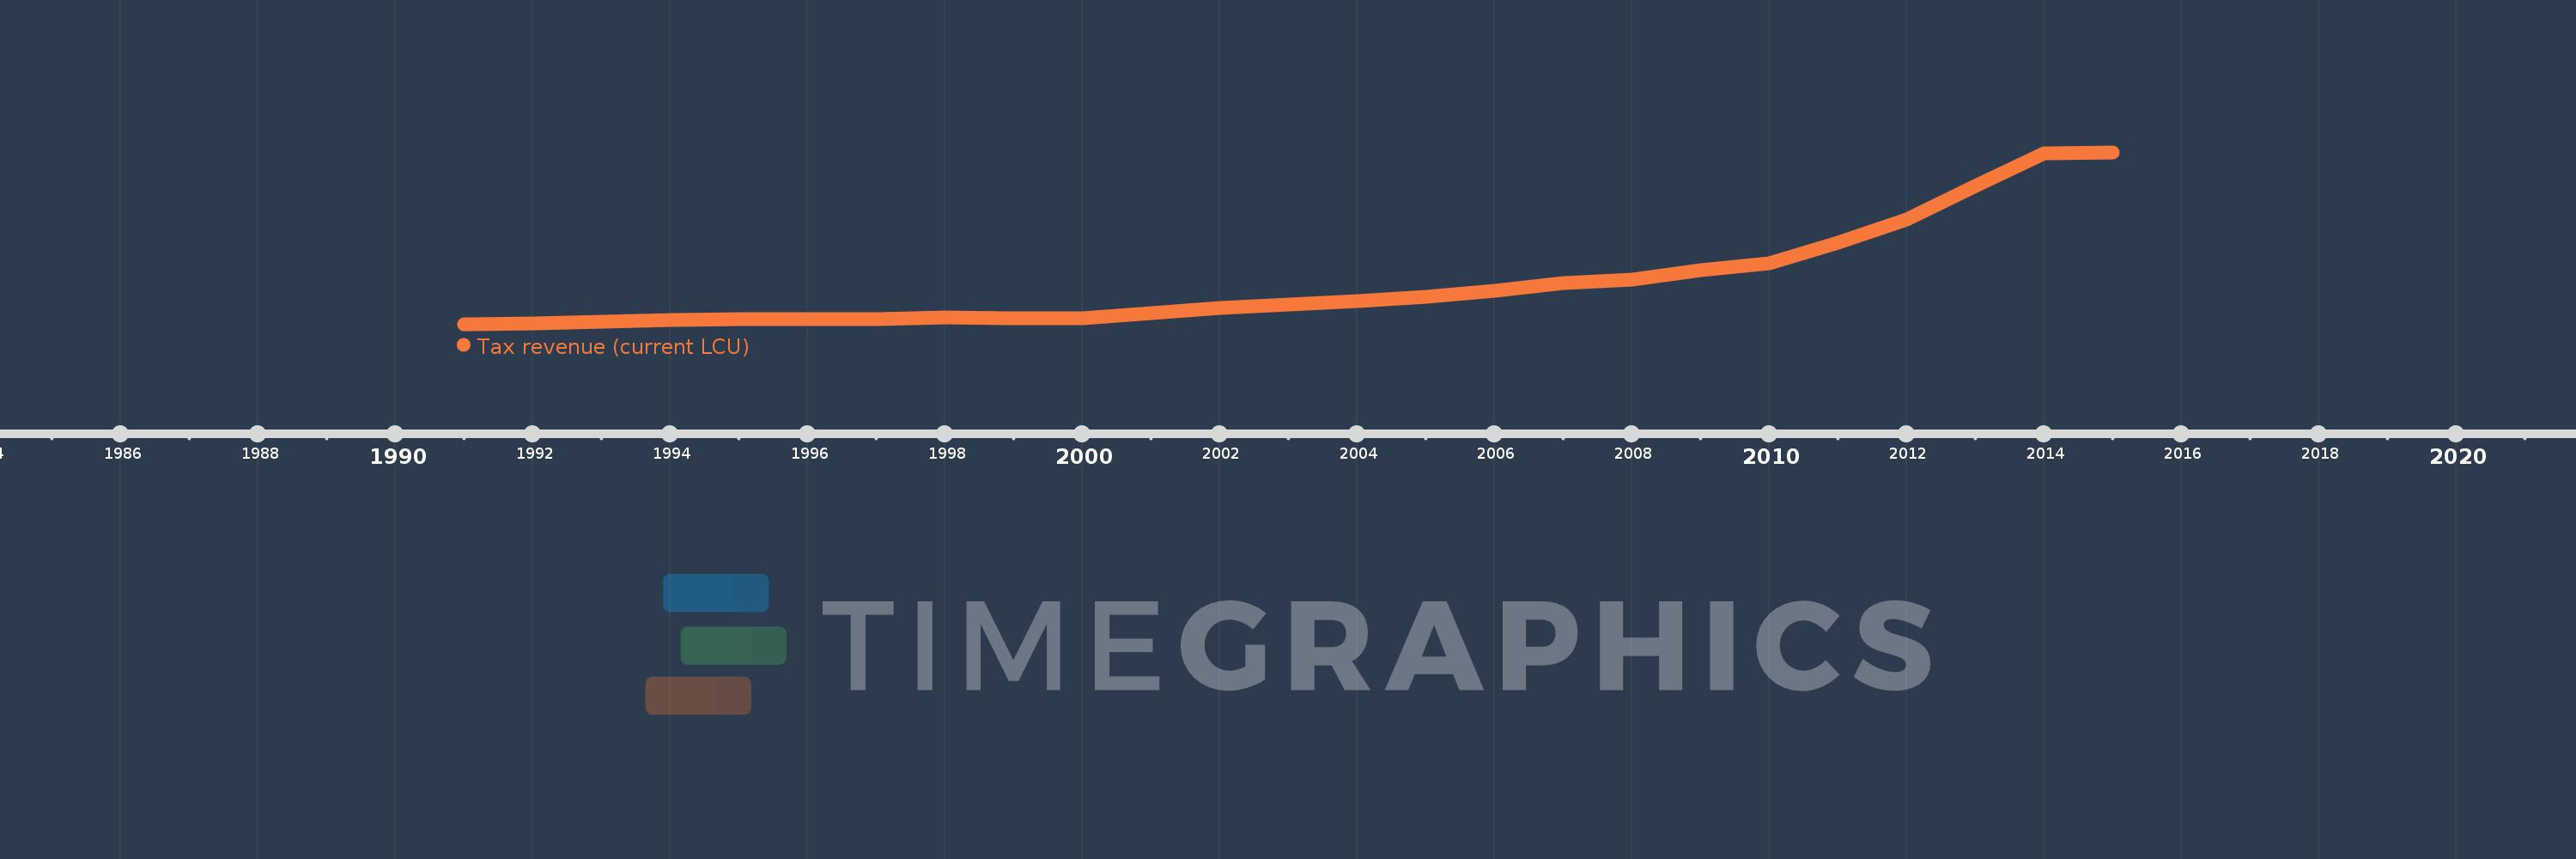
En esta escala de tiempo se presenta un gráfico de 1991 y 2015 de Sierra Leone. Los datos de 1990 están ausentes. El número de observaciones reales por fecha: 25.

Fuente (nombre):

Indicadores del desarrollo mundial

Fuente (organización):

International Monetary Fund, Government Finance Statistics Yearbook and data files.

Categorías:

Public Sector

Se ha actualizado:

23 abr 2017 año

Los indicadores de los cambios de valor en los últimos años

En promedio:
477.454 bn
Mínimo:
5.231 bn
1 ene 1991 año
Máximo:
1.95 billones
1 ene 2015 año
A la fecha de observación
Valor
Cambio absoluto
El cambio con respecto al valor anterior
1 ene 1991 año
5.231 bn
+5.231 bn
0.0%
1 ene 1992 año
17.208 bn
+11.977 bn
228.96%
1 ene 1993 año
34.395 bn
+17.187 bn
99.88%
1 ene 1994 año
51.633 bn
+17.238 bn
50.12%
1 ene 1995 año
64.907 bn
+13.274 bn
25.71%
1 ene 1996 año
59.462 bn
-5.445 bn
-8.39%
1 ene 1997 año
66.428 bn
+6.966 bn
11.72%
1 ene 1998 año
82.708 bn
+16.28 bn
24.51%
1 ene 1999 año
75.692 bn
-7.016 bn
-8.48%
1 ene 2000 año
76.016 bn
+323.688 millones
0.43%
1 ene 2001 año
135.165 bn
+59.15 bn
77.81%
1 ene 2002 año
192.577 bn
+57.411 bn
42.47%
1 ene 2003 año
223.47 bn
+30.894 bn
16.04%
1 ene 2004 año
267.959 bn
+44.489 bn
19.91%
1 ene 2005 año
319.269 bn
+51.309 bn
19.15%
1 ene 2006 año
385.582 bn
+66.313 bn
20.77%
1 ene 2007 año
470.891 bn
+85.309 bn
22.12%
1 ene 2008 año
507.466 bn
+36.575 bn
7.77%
1 ene 2009 año
613.48 bn
+106.014 bn
20.89%
1 ene 2010 año
698.873 bn
+85.393 bn
13.92%
1 ene 2011 año
931.291 bn
+232.418 bn
33.26%
1 ene 2012 año
1.191 billones
+259.949 bn
27.91%
1 ene 2013 año
1.571 billones
+379.98 bn
31.9%
1 ene 2014 año
1.944 billones
+372.77 bn
23.72%
1 ene 2015 año
1.95 billones
+6.21 bn
0.32%

Ranking de los países por los datos estadísticos actuales