30
/es/
AIzaSyAYiBZKx7MnpbEhh9jyipgxe19OcubqV5w
April 1, 2024
101631
Canada
CAN
true
2
1
Tax revenue (current LCU)
2016,2015,2014,2013,2012,2011,2010,2009,2008,2007,2006,2005,2004,2003,2002,2001,2000,1999,1998,1997,1996,1995,1994,1993,1992,1991
Download
Estadísticas Globales de la Biblioteca →Canada →

Tax revenue (current LCU)

Estas estadísticas en otros países:

AfghanistanAlbaniaAlgeriaAngolaAntigua and BarbudaArgentinaArmeniaAustraliaAustriaAzerbaijanBahamas, TheBahrainBangladeshBarbadosBelarusBelgiumBelizeBeninBhutanBoliviaBosnia and HerzegovinaBotswanaBrazilBulgariaBurkina FasoBurundiCabo VerdeCambodiaCanadaCentral African RepublicChileChinaColombiaCongo, Dem. Rep.Congo, Rep.Costa RicaCote d'IvoireCroatiaCyprusCzech RepublicDenmarkDominicaDominican RepublicEgypt, Arab Rep.El SalvadorEquatorial GuineaEstoniaEthiopiaFijiFinlandFranceGambia, TheGeorgiaGermanyGhanaGreeceGrenadaGuatemalaHondurasHong Kong SAR, ChinaHungaryIcelandIndiaIndonesiaIran, Islamic Rep.IraqIrelandIsraelItalyJamaicaJapanJordanKazakhstanKenyaKiribatiKorea, Rep.KuwaitKyrgyz RepublicLao PDRLatviaLebanonLesothoLiberiaLithuaniaLuxembourgMacao SAR, ChinaMacedonia, FYRMadagascarMalawiMalaysiaMaldivesMaliMaltaMauritiusMexicoMicronesia, Fed. Sts.MoldovaMongoliaMoroccoMozambiqueMyanmarNamibiaNepalNetherlandsNew ZealandNicaraguaNigeriaNorwayOmanPakistanPanamaPapua New GuineaParaguayPeruPhilippinesPolandPortugalQatarRomaniaRussian FederationRwandaSamoaSan MarinoSao Tome and PrincipeSenegalSerbiaSeychellesSierra LeoneSingaporeSlovak RepublicSloveniaSolomon IslandsSouth AfricaSpainSri LankaSt. Kitts and NevisSt. LuciaSt. Vincent and the GrenadinesSurinameSwazilandSwedenSwitzerlandSyrian Arab RepublicTajikistanTanzaniaThailandTimor-LesteTogoTrinidad and TobagoTunisiaTurkeyUgandaUkraineUnited Arab EmiratesUnited KingdomUnited StatesUruguayVanuatuVenezuela, RBVietnamWest Bank and GazaYemen, Rep.ZambiaZimbabwe

línea de tiempo (timeline):

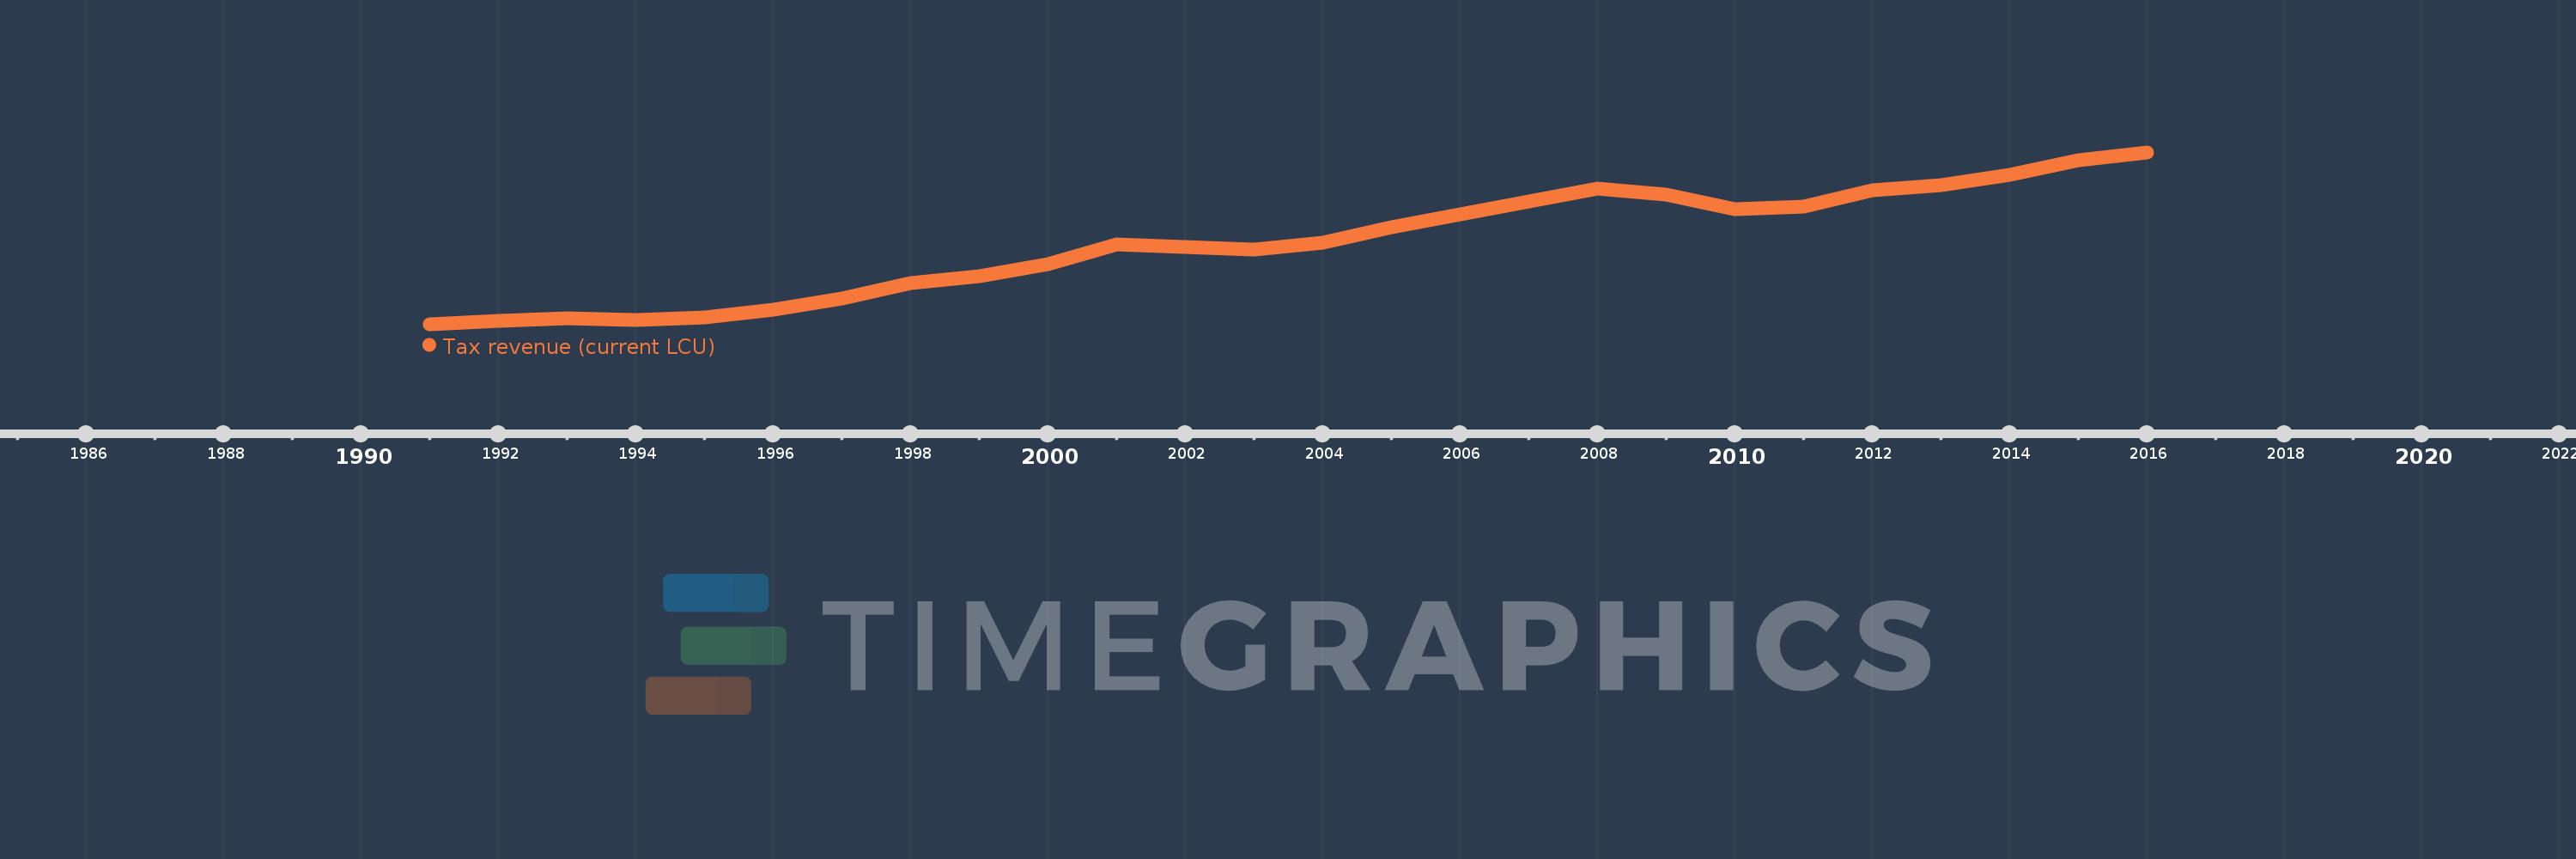
En esta escala de tiempo se presenta un gráfico de 1991 y 2016 de Canada. Los datos de 1990 están ausentes. El número de observaciones reales por fecha: 26.

Fuente (nombre):

Indicadores del desarrollo mundial

Fuente (organización):

International Monetary Fund, Government Finance Statistics Yearbook and data files.

Categorías:

Public Sector

Se ha actualizado:

23 abr 2017 año

Los indicadores de los cambios de valor en los últimos años

En promedio:
165.336 bn
Mínimo:
98.15 bn
1 ene 1991 año
Máximo:
240.558 bn
1 ene 2016 año
A la fecha de observación
Valor
Cambio absoluto
El cambio con respecto al valor anterior
1 ene 1991 año
98.15 bn
+98.15 bn
0.0%
1 ene 1992 año
101.039 bn
+2.889 bn
2.94%
1 ene 1993 año
102.8 bn
+1.761 bn
1.74%
1 ene 1994 año
101.988 bn
-812.0 millones
-0.79%
1 ene 1995 año
103.54 bn
+1.552 bn
1.52%
1 ene 1996 año
110.498 bn
+6.958 bn
6.72%
1 ene 1997 año
119.332 bn
+8.834 bn
7.99%
1 ene 1998 año
132.114 bn
+12.782 bn
10.71%
1 ene 1999 año
137.962 bn
+5.848 bn
4.43%
1 ene 2000 año
148.163 bn
+10.201 bn
7.39%
1 ene 2001 año
164.336 bn
+16.173 bn
10.92%
1 ene 2002 año
162.312 bn
-2.024 bn
-1.23%
1 ene 2003 año
159.687 bn
-2.625 bn
-1.62%
1 ene 2004 año
165.989 bn
+6.302 bn
3.95%
1 ene 2005 año
178.249 bn
+12.26 bn
7.39%
1 ene 2006 año
189.062 bn
+10.813 bn
6.07%
1 ene 2007 año
199.766 bn
+10.704 bn
5.66%
1 ene 2008 año
210.372 bn
+10.606 bn
5.31%
1 ene 2009 año
205.31 bn
-5.062 bn
-2.41%
1 ene 2010 año
193.343 bn
-11.967 bn
-5.83%
1 ene 2011 año
195.474 bn
+2.131 bn
1.1%
1 ene 2012 año
209.409 bn
+13.935 bn
7.13%
1 ene 2013 año
213.133 bn
+3.724 bn
1.78%
1 ene 2014 año
222.058 bn
+8.925 bn
4.19%
1 ene 2015 año
234.085 bn
+12.027 bn
5.42%
1 ene 2016 año
240.558 bn
+6.473 bn
2.77%

Ranking de los países por los datos estadísticos actuales