30
/es/
AIzaSyAYiBZKx7MnpbEhh9jyipgxe19OcubqV5w
April 1, 2024
168264
Kenya
KEN
true
2
1
Tax revenue (current LCU)
2014,2013,2012,2011,2010,2009,2008,2007,2006,2005,2004,2003,2002,2001,2000,1999,1998,1997,1996,1995,1994,1993,1992
Download
Estadísticas Globales de la Biblioteca →Kenya →

Tax revenue (current LCU)

Estas estadísticas en otros países:

AfghanistanAlbaniaAlgeriaAngolaAntigua and BarbudaArgentinaArmeniaAustraliaAustriaAzerbaijanBahamas, TheBahrainBangladeshBarbadosBelarusBelgiumBelizeBeninBhutanBoliviaBosnia and HerzegovinaBotswanaBrazilBulgariaBurkina FasoBurundiCabo VerdeCambodiaCanadaCentral African RepublicChileChinaColombiaCongo, Dem. Rep.Congo, Rep.Costa RicaCote d'IvoireCroatiaCyprusCzech RepublicDenmarkDominicaDominican RepublicEgypt, Arab Rep.El SalvadorEquatorial GuineaEstoniaEthiopiaFijiFinlandFranceGambia, TheGeorgiaGermanyGhanaGreeceGrenadaGuatemalaHondurasHong Kong SAR, ChinaHungaryIcelandIndiaIndonesiaIran, Islamic Rep.IraqIrelandIsraelItalyJamaicaJapanJordanKazakhstanKenyaKiribatiKorea, Rep.KuwaitKyrgyz RepublicLao PDRLatviaLebanonLesothoLiberiaLithuaniaLuxembourgMacao SAR, ChinaMacedonia, FYRMadagascarMalawiMalaysiaMaldivesMaliMaltaMauritiusMexicoMicronesia, Fed. Sts.MoldovaMongoliaMoroccoMozambiqueMyanmarNamibiaNepalNetherlandsNew ZealandNicaraguaNigeriaNorwayOmanPakistanPanamaPapua New GuineaParaguayPeruPhilippinesPolandPortugalQatarRomaniaRussian FederationRwandaSamoaSan MarinoSao Tome and PrincipeSenegalSerbiaSeychellesSierra LeoneSingaporeSlovak RepublicSloveniaSolomon IslandsSouth AfricaSpainSri LankaSt. Kitts and NevisSt. LuciaSt. Vincent and the GrenadinesSurinameSwazilandSwedenSwitzerlandSyrian Arab RepublicTajikistanTanzaniaThailandTimor-LesteTogoTrinidad and TobagoTunisiaTurkeyUgandaUkraineUnited Arab EmiratesUnited KingdomUnited StatesUruguayVanuatuVenezuela, RBVietnamWest Bank and GazaYemen, Rep.ZambiaZimbabwe

línea de tiempo (timeline):

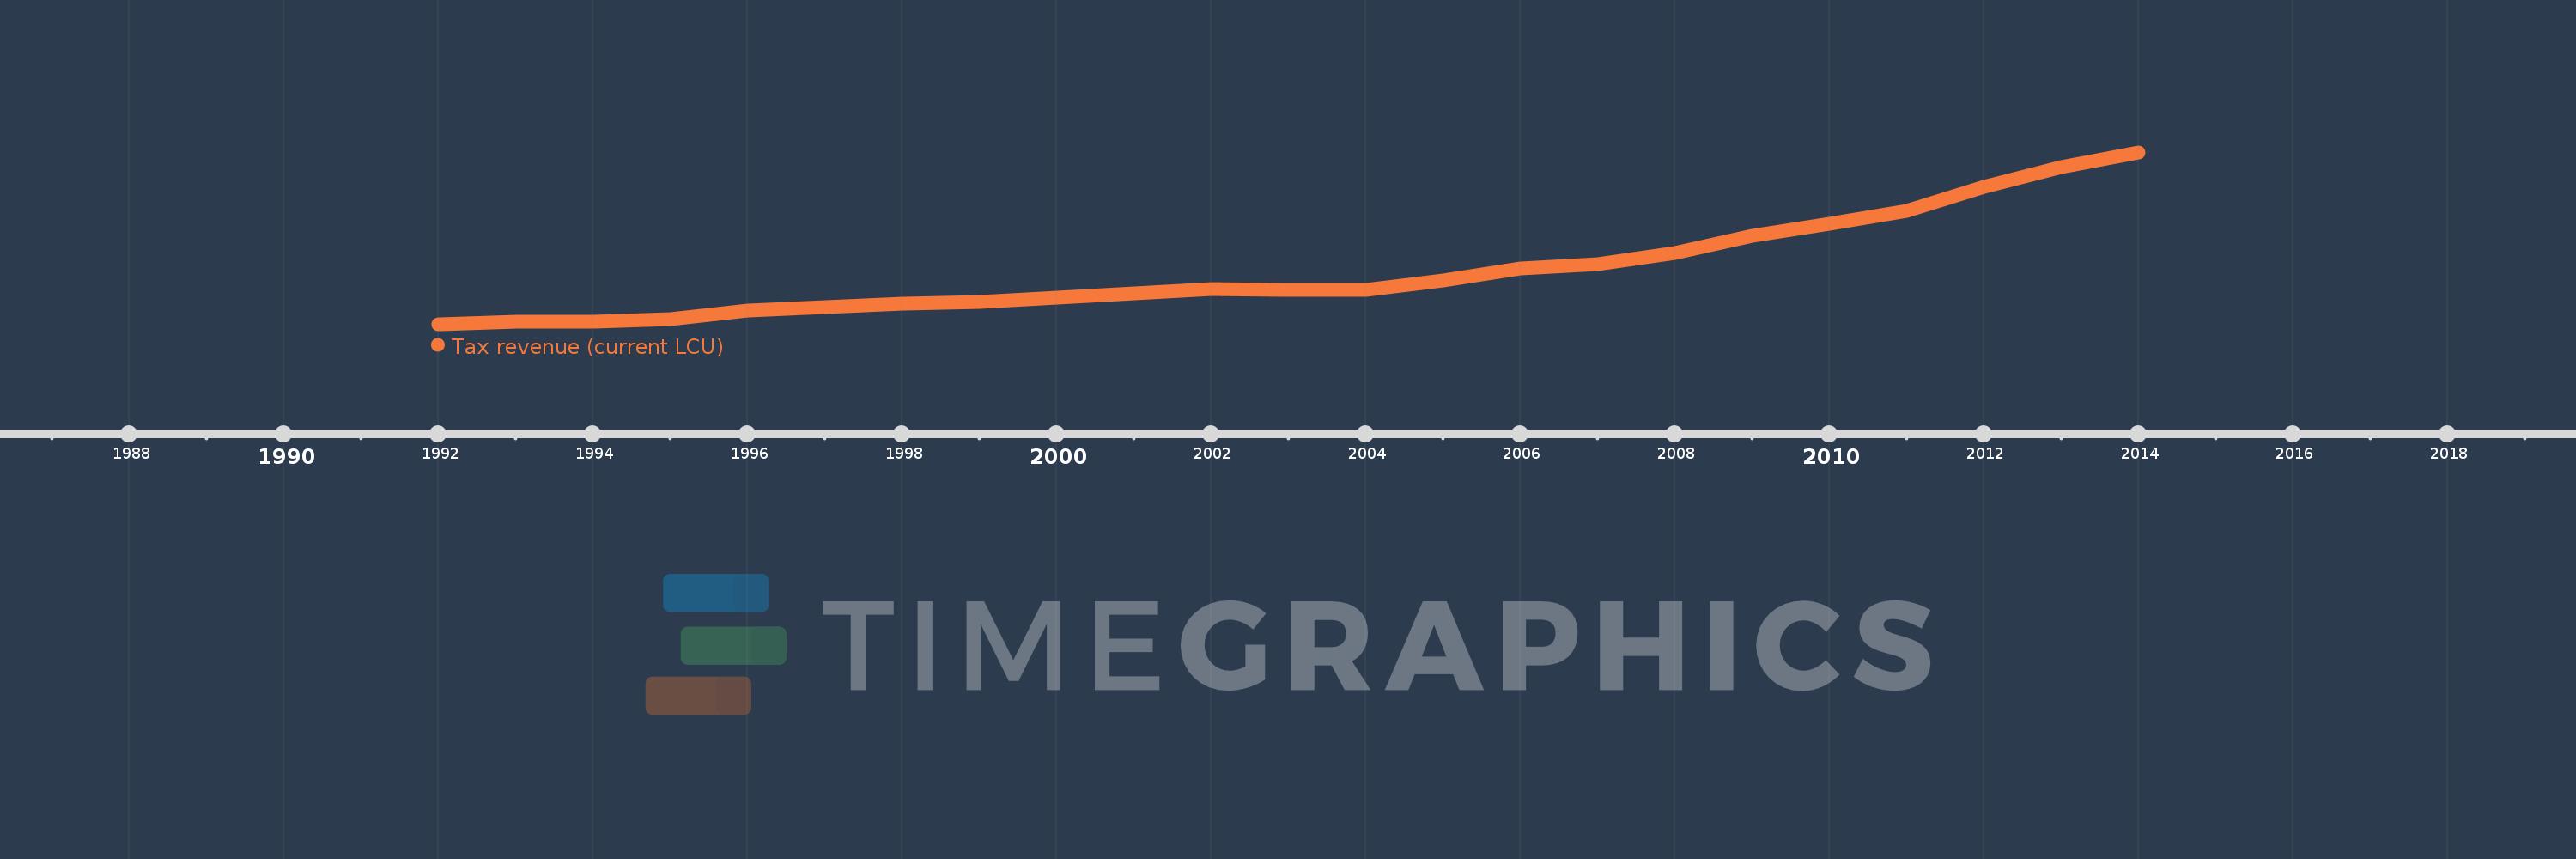
En esta escala de tiempo se presenta un gráfico de 1992 y 2014 de Kenya. Los datos de 1991 están ausentes. El número de observaciones reales por fecha: 23.

Fuente (nombre):

Indicadores del desarrollo mundial

Fuente (organización):

International Monetary Fund, Government Finance Statistics Yearbook and data files.

Categorías:

Public Sector

Se ha actualizado:

23 abr 2017 año

Los indicadores de los cambios de valor en los últimos años

En promedio:
258.145 bn
Mínimo:
39.518 bn
1 ene 1992 año
Máximo:
734.582 bn
1 ene 2014 año
A la fecha de observación
Valor
Cambio absoluto
El cambio con respecto al valor anterior
1 ene 1992 año
39.518 bn
+39.518 bn
0.0%
1 ene 1993 año
48.682 bn
+9.164 bn
23.19%
1 ene 1994 año
49.927 bn
+1.245 bn
2.56%
1 ene 1995 año
59.84 bn
+9.913 bn
19.85%
1 ene 1996 año
95.35 bn
+35.51 bn
59.34%
1 ene 1997 año
109.031 bn
+13.681 bn
14.35%
1 ene 1998 año
123.729 bn
+14.698 bn
13.48%
1 ene 1999 año
128.127 bn
+4.398 bn
3.55%
1 ene 2000 año
146.509 bn
+18.382 bn
14.35%
1 ene 2001 año
162.898 bn
+16.389 bn
11.19%
1 ene 2002 año
181.924 bn
+19.025 bn
11.68%
1 ene 2003 año
179.064 bn
-2.86 bn
-1.57%
1 ene 2004 año
178.434 bn
-629.445 millones
-0.35%
1 ene 2005 año
216.29 bn
+37.855 bn
21.22%
1 ene 2006 año
264.322 bn
+48.033 bn
22.21%
1 ene 2007 año
281.94 bn
+17.618 bn
6.67%
1 ene 2008 año
326.185 bn
+44.245 bn
15.69%
1 ene 2009 año
396.386 bn
+70.2 bn
21.52%
1 ene 2010 año
445.167 bn
+48.781 bn
12.31%
1 ene 2011 año
498.637 bn
+53.47 bn
12.01%
1 ene 2012 año
594.198 bn
+95.561 bn
19.16%
1 ene 2013 año
676.601 bn
+82.404 bn
13.87%
1 ene 2014 año
734.582 bn
+57.981 bn
8.57%

Ranking de los países por los datos estadísticos actuales