29
/es/
es
AIzaSyAYiBZKx7MnpbEhh9jyipgxe19OcubqV5w
April 1, 2024
234987
Saudi Arabia
SAU
true
2
1
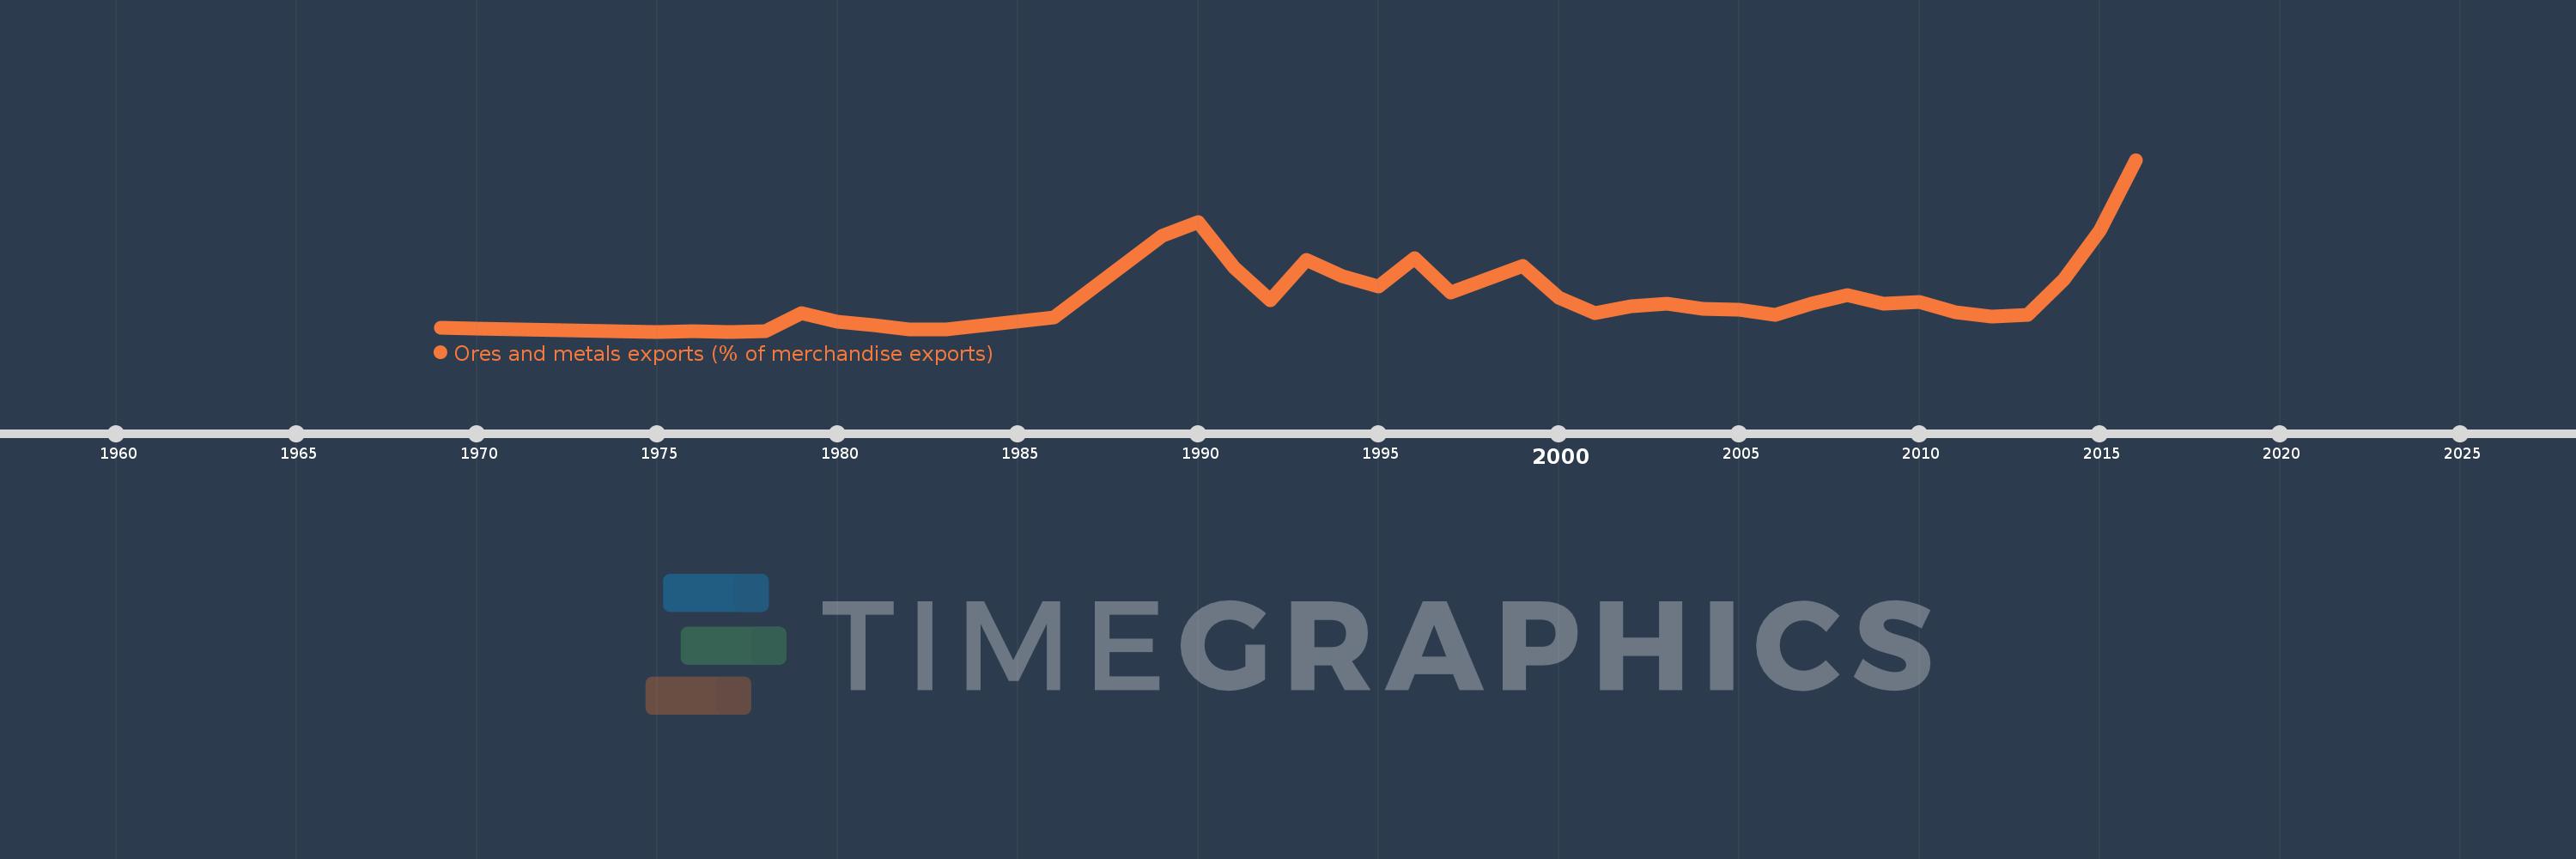
Ores and metals exports (% of merchandise exports)
2016,2015,2014,2013,2012,2011,2010,2009,2008,2007,2006,2005,2004,2003,2002,2001,2000,1999,1997,1996,1995,1994,1993,1992,1991,1990,1989,1986,1983,1982,1981,1980,1979,1978,1977,1976,1975,1970,1969
Estas estadísticas en otros países:
AfghanistanAlbaniaAlgeriaAndorraAngolaAntigua and BarbudaArab WorldArgentinaArmeniaArubaAustraliaAustriaAzerbaijanBahamas, TheBahrainBangladeshBarbadosBelarusBelgiumBelizeBeninBermudaBhutanBoliviaBosnia and HerzegovinaBotswanaBrazilBrunei DarussalamBulgariaBurkina FasoBurundiCabo VerdeCambodiaCameroonCanadaCaribbean small statesCayman IslandsCentral African RepublicCentral Europe and the BalticsChadChileChinaColombiaComorosCongo, Dem. Rep.Congo, Rep.Costa RicaCote d'IvoireCroatiaCubaCyprusCzech RepublicDenmarkDjiboutiDominicaDominican RepublicEarly-demographic dividendEast Asia & PacificEast Asia & Pacific (excluding high income)East Asia & Pacific (IDA & IBRD countries)EcuadorEgypt, Arab Rep.El SalvadorEquatorial GuineaEritreaEstoniaEthiopiaEuro areaEurope & Central AsiaEurope & Central Asia (excluding high income)Europe & Central Asia (IDA & IBRD countries)European UnionFaroe IslandsFijiFinlandFragile and conflict affected situationsFranceFrench PolynesiaGabonGambia, TheGeorgiaGermanyGhanaGreeceGreenlandGrenadaGuatemalaGuineaGuinea-BissauGuyanaHaitiHeavily indebted poor countries (HIPC)High incomeHondurasHong Kong SAR, ChinaHungaryIBRD onlyIcelandIDA & IBRD totalIDA blendIDA onlyIDA totalIndiaIndonesiaIran, Islamic Rep.IraqIrelandIsraelItalyJamaicaJapanJordanKazakhstanKenyaKiribatiKorea, Rep.KuwaitKyrgyz RepublicLao PDRLate-demographic dividendLatin America & Caribbean Latin America & Caribbean (excluding high income)Latin America & the Caribbean (IDA & IBRD countries)LatviaLeast developed countries: UN classificationLebanonLesothoLiberiaLibyaLithuaniaLow & middle incomeLower middle incomeLuxembourgMacao SAR, ChinaMacedonia, FYRMadagascarMalawiMalaysiaMaldivesMaliMaltaMauritaniaMauritiusMexicoMiddle East & North AfricaMiddle East & North Africa (excluding high income)Middle East & North Africa (IDA & IBRD countries)Middle incomeMoldovaMongoliaMoroccoMozambiqueMyanmarNamibiaNepalNetherlandsNew CaledoniaNew ZealandNicaraguaNigerNigeriaNorth AmericaNorwayOECD membersOmanOther small statesPacific island small statesPakistanPalauPanamaPapua New GuineaParaguayPeruPhilippinesPolandPortugalPost-demographic dividendPre-demographic dividendQatarRomaniaRussian FederationRwandaSamoaSao Tome and PrincipeSaudi ArabiaSenegalSerbiaSeychellesSierra LeoneSingaporeSlovak RepublicSloveniaSmall statesSolomon IslandsSomaliaSouth AfricaSouth AsiaSouth Asia (IDA & IBRD)SpainSri LankaSt. Kitts and NevisSt. LuciaSt. Vincent and the GrenadinesSub-Saharan Africa Sub-Saharan Africa (excluding high income)Sub-Saharan Africa (IDA & IBRD countries)SudanSurinameSwazilandSwedenSwitzerlandSyrian Arab RepublicTajikistanTanzaniaThailandTimor-LesteTogoTongaTrinidad and TobagoTunisiaTurkeyTurkmenistanTurks and Caicos IslandsUgandaUkraineUnited Arab EmiratesUnited KingdomUnited StatesUpper middle incomeUruguayVanuatuVenezuela, RBVietnamVirgin Islands (U.S.)WorldYemen, Rep.ZambiaZimbabwe línea de tiempo (timeline):
En esta escala de tiempo se presenta un gráfico de 1969 y 2016 de Saudi Arabia. Los datos de 1968 están ausentes. El número de observaciones reales por fecha: 39.
Fuente (nombre):
Indicadores del desarrollo mundial
Fuente (organización):
World Bank staff estimates from the Comtrade database maintained by the United Nations Statistics Division.
Categorías:
Energy & Mining, Private Sector, Trade
Se ha actualizado:
23 abr 2017 año
Los indicadores de los cambios de valor en los últimos años
Mínimo:
0.009
1 ene 1975 año
Máximo:
1.308
1 ene 2016 año
A la fecha de observación
Valor
Cambio absoluto
El cambio con respecto al valor anterior
1 ene 1969 año
0.04
+0.04
0.0%
1 ene 1970 año
0.033
-0.007
-16.93%
1 ene 1975 año
0.009
-0.025
-74.04%
1 ene 1976 año
0.015
+0.006
74.91%
1 ene 1977 año
0.009
-0.006
-42.01%
1 ene 1978 año
0.012
+0.003
32.4%
1 ene 1979 año
0.149
+0.138
1.19 mil%
1 ene 1980 año
0.081
-0.068
-45.72%
1 ene 1981 año
0.06
-0.021
-25.82%
1 ene 1982 año
0.024
-0.036
-59.46%
1 ene 1983 año
0.026
+0.001
5.37%
1 ene 1986 año
0.117
+0.091
355.59%
1 ene 1989 año
0.732
+0.615
526.07%
1 ene 1990 año
0.834
+0.102
13.96%
1 ene 1991 año
0.491
-0.343
-41.15%
1 ene 1992 año
0.243
-0.248
-50.56%
1 ene 1993 año
0.549
+0.306
126.1%
1 ene 1994 año
0.43
-0.119
-21.66%
1 ene 1995 año
0.347
-0.083
-19.37%
1 ene 1996 año
0.567
+0.221
63.61%
1 ene 1997 año
0.305
-0.262
-46.24%
1 ene 1999 año
0.507
+0.202
66.28%
1 ene 2000 año
0.263
-0.245
-48.22%
1 ene 2001 año
0.147
-0.115
-43.95%
1 ene 2002 año
0.202
+0.055
37.05%
1 ene 2003 año
0.223
+0.022
10.7%
1 ene 2004 año
0.183
-0.041
-18.17%
1 ene 2005 año
0.173
-0.01
-5.42%
1 ene 2006 año
0.137
-0.036
-20.55%
1 ene 2007 año
0.22
+0.082
59.9%
1 ene 2008 año
0.284
+0.064
29.18%
1 ene 2009 año
0.222
-0.062
-21.72%
1 ene 2010 año
0.232
+0.011
4.74%
1 ene 2011 año
0.155
-0.078
-33.48%
1 ene 2012 año
0.122
-0.032
-20.94%
1 ene 2013 año
0.138
+0.016
13.24%
1 ene 2014 año
0.403
+0.265
191.16%
1 ene 2015 año
0.769
+0.366
90.77%
1 ene 2016 año
1.308
+0.539
70.02%
Ranking de los países por los datos estadísticos actuales


Comentarios: