29
/es/
es
AIzaSyAYiBZKx7MnpbEhh9jyipgxe19OcubqV5w
April 1, 2024
185627
Madagascar
MDG
true
2
1
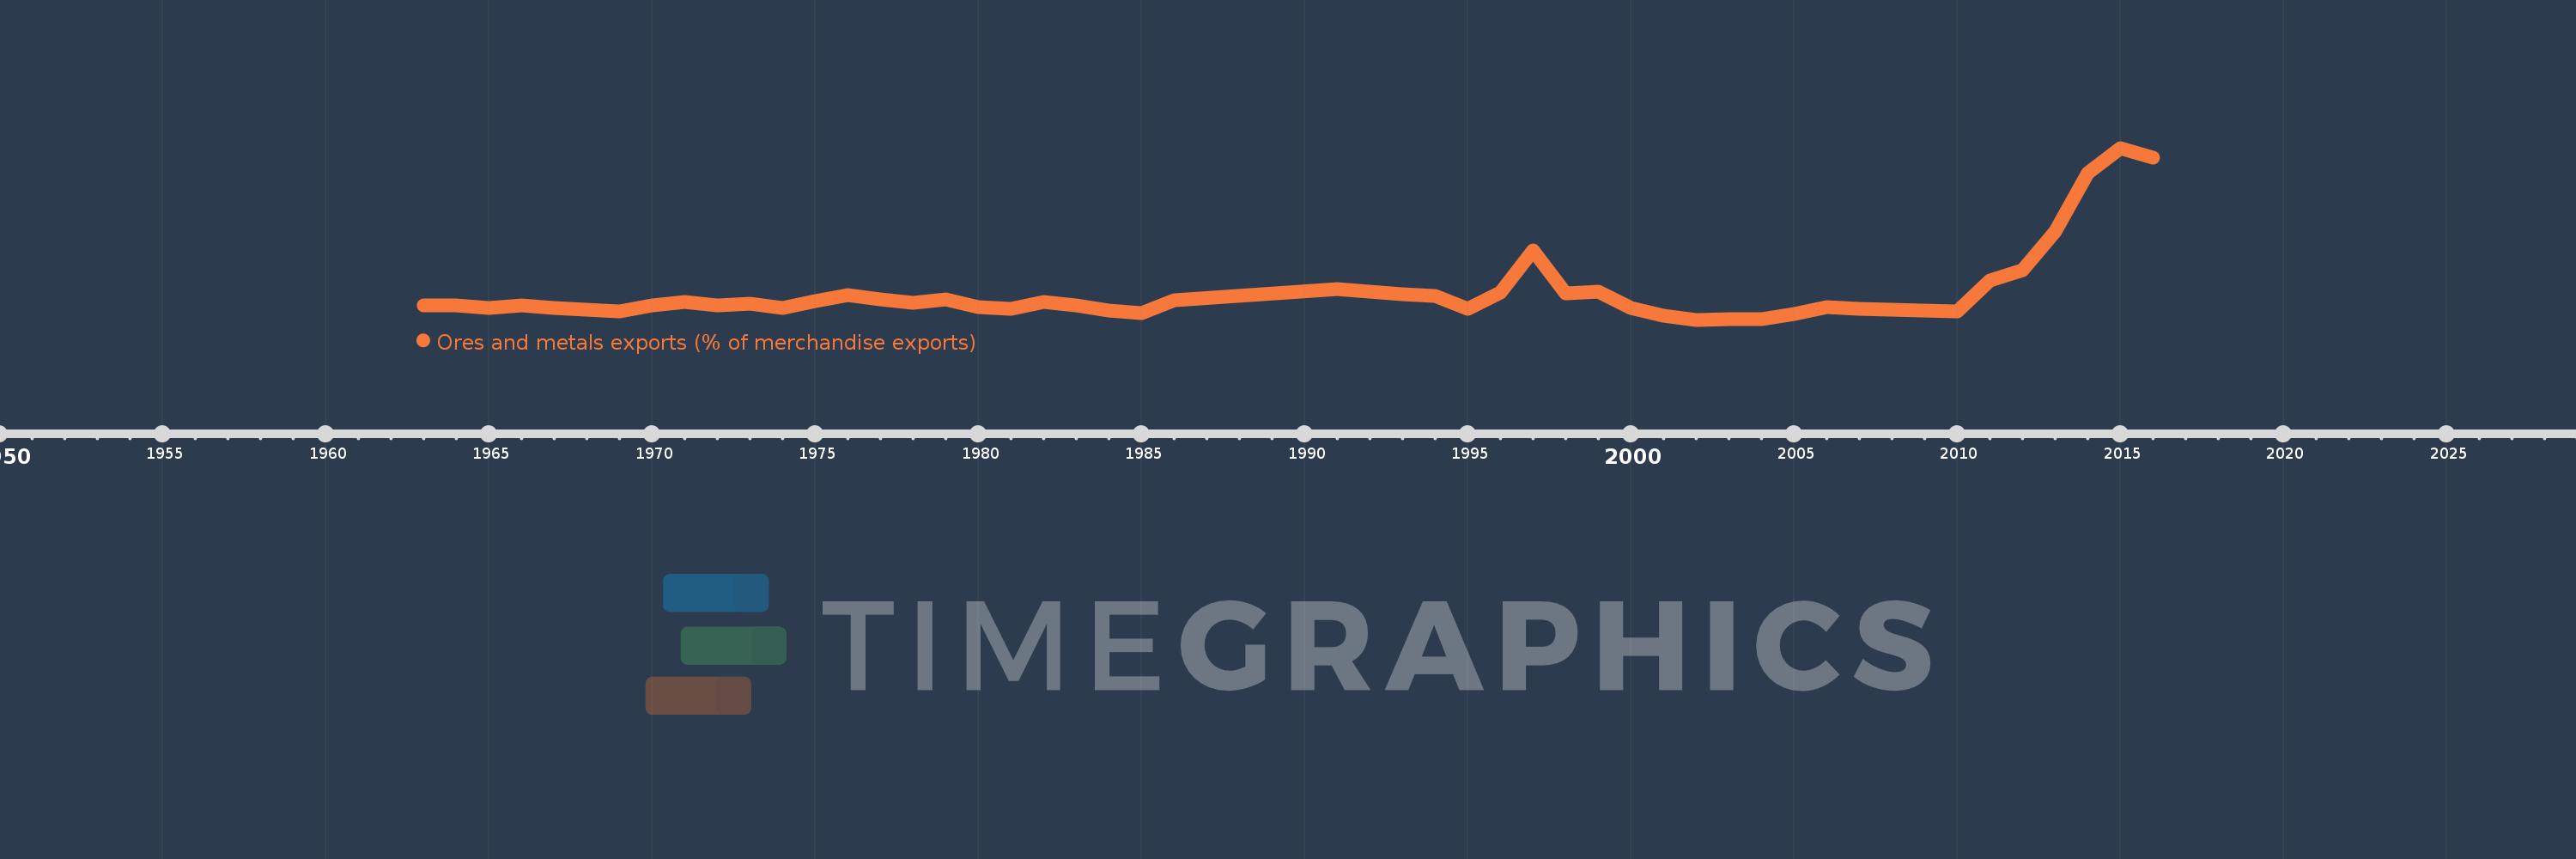
Ores and metals exports (% of merchandise exports)
2016,2015,2014,2013,2012,2011,2010,2009,2008,2007,2006,2005,2004,2003,2002,2001,2000,1999,1998,1997,1996,1995,1994,1993,1992,1991,1986,1985,1984,1983,1982,1981,1980,1979,1978,1977,1976,1975,1974,1973,1972,1971,1970,1969,1968,1967,1966,1965,1964,1963
Estas estadísticas en otros países:
AfghanistanAlbaniaAlgeriaAndorraAngolaAntigua and BarbudaArab WorldArgentinaArmeniaArubaAustraliaAustriaAzerbaijanBahamas, TheBahrainBangladeshBarbadosBelarusBelgiumBelizeBeninBermudaBhutanBoliviaBosnia and HerzegovinaBotswanaBrazilBrunei DarussalamBulgariaBurkina FasoBurundiCabo VerdeCambodiaCameroonCanadaCaribbean small statesCayman IslandsCentral African RepublicCentral Europe and the BalticsChadChileChinaColombiaComorosCongo, Dem. Rep.Congo, Rep.Costa RicaCote d'IvoireCroatiaCubaCyprusCzech RepublicDenmarkDjiboutiDominicaDominican RepublicEarly-demographic dividendEast Asia & PacificEast Asia & Pacific (excluding high income)East Asia & Pacific (IDA & IBRD countries)EcuadorEgypt, Arab Rep.El SalvadorEquatorial GuineaEritreaEstoniaEthiopiaEuro areaEurope & Central AsiaEurope & Central Asia (excluding high income)Europe & Central Asia (IDA & IBRD countries)European UnionFaroe IslandsFijiFinlandFragile and conflict affected situationsFranceFrench PolynesiaGabonGambia, TheGeorgiaGermanyGhanaGreeceGreenlandGrenadaGuatemalaGuineaGuinea-BissauGuyanaHaitiHeavily indebted poor countries (HIPC)High incomeHondurasHong Kong SAR, ChinaHungaryIBRD onlyIcelandIDA & IBRD totalIDA blendIDA onlyIDA totalIndiaIndonesiaIran, Islamic Rep.IraqIrelandIsraelItalyJamaicaJapanJordanKazakhstanKenyaKiribatiKorea, Rep.KuwaitKyrgyz RepublicLao PDRLate-demographic dividendLatin America & Caribbean Latin America & Caribbean (excluding high income)Latin America & the Caribbean (IDA & IBRD countries)LatviaLeast developed countries: UN classificationLebanonLesothoLiberiaLibyaLithuaniaLow & middle incomeLower middle incomeLuxembourgMacao SAR, ChinaMacedonia, FYRMadagascarMalawiMalaysiaMaldivesMaliMaltaMauritaniaMauritiusMexicoMiddle East & North AfricaMiddle East & North Africa (excluding high income)Middle East & North Africa (IDA & IBRD countries)Middle incomeMoldovaMongoliaMoroccoMozambiqueMyanmarNamibiaNepalNetherlandsNew CaledoniaNew ZealandNicaraguaNigerNigeriaNorth AmericaNorwayOECD membersOmanOther small statesPacific island small statesPakistanPalauPanamaPapua New GuineaParaguayPeruPhilippinesPolandPortugalPost-demographic dividendPre-demographic dividendQatarRomaniaRussian FederationRwandaSamoaSao Tome and PrincipeSaudi ArabiaSenegalSerbiaSeychellesSierra LeoneSingaporeSlovak RepublicSloveniaSmall statesSolomon IslandsSomaliaSouth AfricaSouth AsiaSouth Asia (IDA & IBRD)SpainSri LankaSt. Kitts and NevisSt. LuciaSt. Vincent and the GrenadinesSub-Saharan Africa Sub-Saharan Africa (excluding high income)Sub-Saharan Africa (IDA & IBRD countries)SudanSurinameSwazilandSwedenSwitzerlandSyrian Arab RepublicTajikistanTanzaniaThailandTimor-LesteTogoTongaTrinidad and TobagoTunisiaTurkeyTurkmenistanTurks and Caicos IslandsUgandaUkraineUnited Arab EmiratesUnited KingdomUnited StatesUpper middle incomeUruguayVanuatuVenezuela, RBVietnamVirgin Islands (U.S.)WorldYemen, Rep.ZambiaZimbabwe línea de tiempo (timeline):
En esta escala de tiempo se presenta un gráfico de 1963 y 2016 de Madagascar. Los datos de 1962 están ausentes. El número de observaciones reales por fecha: 50.
Fuente (nombre):
Indicadores del desarrollo mundial
Fuente (organización):
World Bank staff estimates from the Comtrade database maintained by the United Nations Statistics Division.
Categorías:
Energy & Mining, Private Sector, Trade
Se ha actualizado:
23 abr 2017 año
Los indicadores de los cambios de valor en los últimos años
Mínimo:
1.269
1 ene 2002 año
Máximo:
36.818
1 ene 2015 año
A la fecha de observación
Valor
Cambio absoluto
El cambio con respecto al valor anterior
1 ene 1963 año
4.24
+4.24
0.0%
1 ene 1964 año
4.171
-0.069
-1.64%
1 ene 1965 año
3.675
-0.496
-11.9%
1 ene 1966 año
4.208
+0.534
14.52%
1 ene 1967 año
3.685
-0.524
-12.44%
1 ene 1968 año
3.31
-0.374
-10.16%
1 ene 1969 año
2.932
-0.378
-11.41%
1 ene 1970 año
4.21
+1.277
43.56%
1 ene 1971 año
5.011
+0.801
19.03%
1 ene 1972 año
4.236
-0.775
-15.46%
1 ene 1973 año
4.508
+0.271
6.4%
1 ene 1974 año
3.72
-0.787
-17.47%
1 ene 1975 año
5.1
+1.38
37.1%
1 ene 1976 año
6.385
+1.285
25.19%
1 ene 1977 año
5.424
-0.961
-15.06%
1 ene 1978 año
4.701
-0.723
-13.33%
1 ene 1979 año
5.401
+0.7
14.9%
1 ene 1980 año
3.934
-1.467
-27.16%
1 ene 1981 año
3.586
-0.349
-8.86%
1 ene 1982 año
5.012
+1.426
39.78%
1 ene 1983 año
4.19
-0.823
-16.41%
1 ene 1984 año
3.193
-0.997
-23.79%
1 ene 1985 año
2.603
-0.589
-18.46%
1 ene 1986 año
5.348
+2.745
105.42%
1 ene 1991 año
7.663
+2.315
43.28%
1 ene 1992 año
7.059
-0.603
-7.87%
1 ene 1993 año
6.51
-0.55
-7.79%
1 ene 1994 año
6.208
-0.302
-4.63%
1 ene 1995 año
3.59
-2.619
-42.18%
1 ene 1996 año
6.934
+3.345
93.18%
1 ene 1997 año
15.527
+8.593
123.91%
1 ene 1998 año
6.641
-8.887
-57.23%
1 ene 1999 año
7.151
+0.511
7.69%
1 ene 2000 año
3.776
-3.375
-47.2%
1 ene 2001 año
2.069
-1.707
-45.2%
1 ene 2002 año
1.269
-0.8
-38.67%
1 ene 2003 año
1.373
+0.104
8.22%
1 ene 2004 año
1.412
+0.039
2.84%
1 ene 2005 año
2.491
+1.079
76.4%
1 ene 2006 año
3.94
+1.449
58.15%
1 ene 2007 año
3.607
-0.333
-8.45%
1 ene 2008 año
3.293
-0.314
-8.71%
1 ene 2009 año
3.223
-0.07
-2.12%
1 ene 2010 año
3.018
-0.204
-6.34%
1 ene 2011 año
9.463
+6.445
213.51%
1 ene 2012 año
11.573
+2.11
22.29%
1 ene 2013 año
19.469
+7.896
68.23%
1 ene 2014 año
31.525
+12.056
61.92%
1 ene 2015 año
36.818
+5.293
16.79%
1 ene 2016 año
34.796
-2.022
-5.49%
Ranking de los países por los datos estadísticos actuales


Comentarios: