29
/es/
es
AIzaSyAYiBZKx7MnpbEhh9jyipgxe19OcubqV5w
April 1, 2024
226251
Portugal
PRT
true
2
1
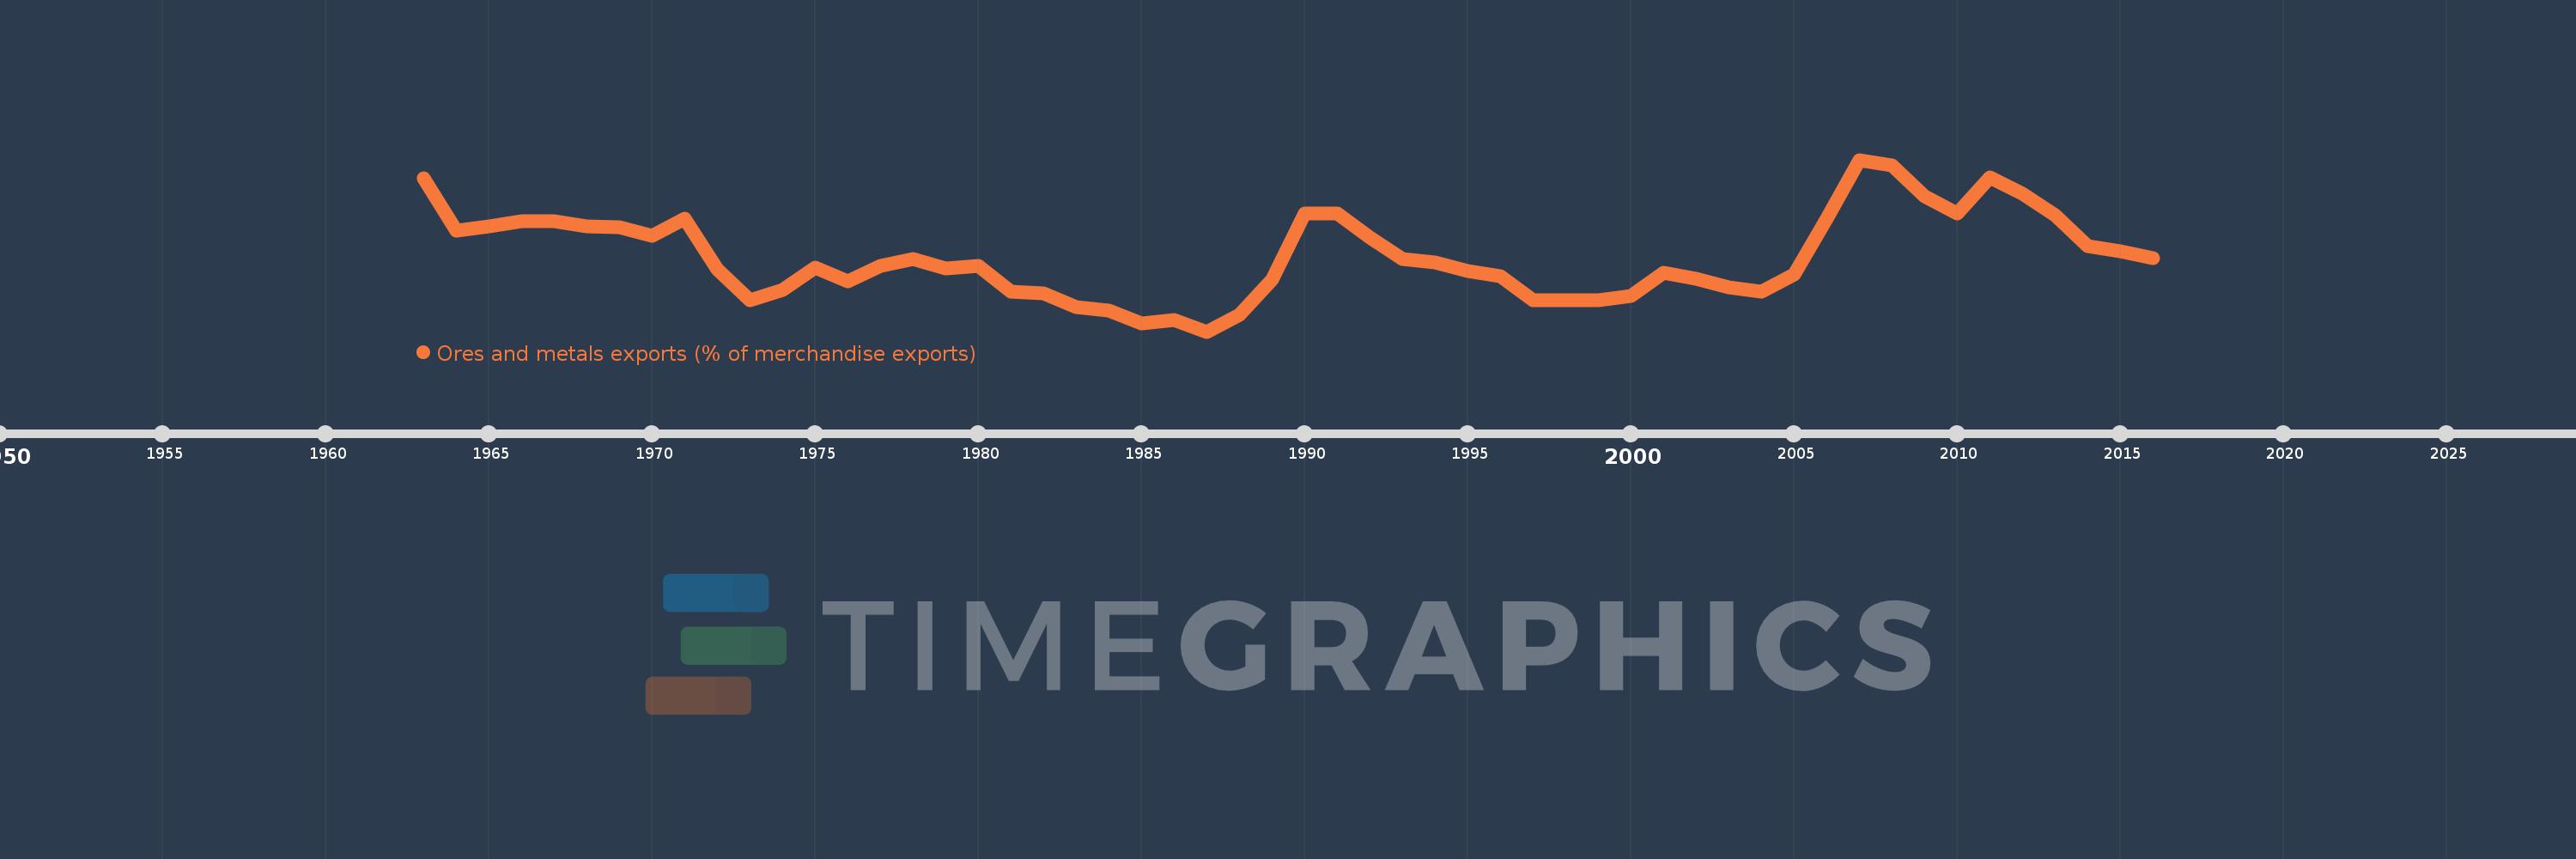
Ores and metals exports (% of merchandise exports)
2016,2015,2014,2013,2012,2011,2010,2009,2008,2007,2006,2005,2004,2003,2002,2001,2000,1999,1998,1997,1996,1995,1994,1993,1992,1991,1990,1989,1988,1987,1986,1985,1984,1983,1982,1981,1980,1979,1978,1977,1976,1975,1974,1973,1972,1971,1970,1969,1968,1967,1966,1965,1964,1963
Estas estadísticas en otros países:
AfghanistanAlbaniaAlgeriaAndorraAngolaAntigua and BarbudaArab WorldArgentinaArmeniaArubaAustraliaAustriaAzerbaijanBahamas, TheBahrainBangladeshBarbadosBelarusBelgiumBelizeBeninBermudaBhutanBoliviaBosnia and HerzegovinaBotswanaBrazilBrunei DarussalamBulgariaBurkina FasoBurundiCabo VerdeCambodiaCameroonCanadaCaribbean small statesCayman IslandsCentral African RepublicCentral Europe and the BalticsChadChileChinaColombiaComorosCongo, Dem. Rep.Congo, Rep.Costa RicaCote d'IvoireCroatiaCubaCyprusCzech RepublicDenmarkDjiboutiDominicaDominican RepublicEarly-demographic dividendEast Asia & PacificEast Asia & Pacific (excluding high income)East Asia & Pacific (IDA & IBRD countries)EcuadorEgypt, Arab Rep.El SalvadorEquatorial GuineaEritreaEstoniaEthiopiaEuro areaEurope & Central AsiaEurope & Central Asia (excluding high income)Europe & Central Asia (IDA & IBRD countries)European UnionFaroe IslandsFijiFinlandFragile and conflict affected situationsFranceFrench PolynesiaGabonGambia, TheGeorgiaGermanyGhanaGreeceGreenlandGrenadaGuatemalaGuineaGuinea-BissauGuyanaHaitiHeavily indebted poor countries (HIPC)High incomeHondurasHong Kong SAR, ChinaHungaryIBRD onlyIcelandIDA & IBRD totalIDA blendIDA onlyIDA totalIndiaIndonesiaIran, Islamic Rep.IraqIrelandIsraelItalyJamaicaJapanJordanKazakhstanKenyaKiribatiKorea, Rep.KuwaitKyrgyz RepublicLao PDRLate-demographic dividendLatin America & Caribbean Latin America & Caribbean (excluding high income)Latin America & the Caribbean (IDA & IBRD countries)LatviaLeast developed countries: UN classificationLebanonLesothoLiberiaLibyaLithuaniaLow & middle incomeLower middle incomeLuxembourgMacao SAR, ChinaMacedonia, FYRMadagascarMalawiMalaysiaMaldivesMaliMaltaMauritaniaMauritiusMexicoMiddle East & North AfricaMiddle East & North Africa (excluding high income)Middle East & North Africa (IDA & IBRD countries)Middle incomeMoldovaMongoliaMoroccoMozambiqueMyanmarNamibiaNepalNetherlandsNew CaledoniaNew ZealandNicaraguaNigerNigeriaNorth AmericaNorwayOECD membersOmanOther small statesPacific island small statesPakistanPalauPanamaPapua New GuineaParaguayPeruPhilippinesPolandPortugalPost-demographic dividendPre-demographic dividendQatarRomaniaRussian FederationRwandaSamoaSao Tome and PrincipeSaudi ArabiaSenegalSerbiaSeychellesSierra LeoneSingaporeSlovak RepublicSloveniaSmall statesSolomon IslandsSomaliaSouth AfricaSouth AsiaSouth Asia (IDA & IBRD)SpainSri LankaSt. Kitts and NevisSt. LuciaSt. Vincent and the GrenadinesSub-Saharan Africa Sub-Saharan Africa (excluding high income)Sub-Saharan Africa (IDA & IBRD countries)SudanSurinameSwazilandSwedenSwitzerlandSyrian Arab RepublicTajikistanTanzaniaThailandTimor-LesteTogoTongaTrinidad and TobagoTunisiaTurkeyTurkmenistanTurks and Caicos IslandsUgandaUkraineUnited Arab EmiratesUnited KingdomUnited StatesUpper middle incomeUruguayVanuatuVenezuela, RBVietnamVirgin Islands (U.S.)WorldYemen, Rep.ZambiaZimbabwe línea de tiempo (timeline):
En esta escala de tiempo se presenta un gráfico de 1963 y 2016 de Portugal. Los datos de 1962 están ausentes. El número de observaciones reales por fecha: 54.
Fuente (nombre):
Indicadores del desarrollo mundial
Fuente (organización):
World Bank staff estimates from the Comtrade database maintained by the United Nations Statistics Division.
Categorías:
Energy & Mining, Private Sector, Trade
Se ha actualizado:
23 abr 2017 año
Los indicadores de los cambios de valor en los últimos años
Mínimo:
0.881
1 ene 1987 año
Máximo:
3.828
1 ene 2007 año
A la fecha de observación
Valor
Cambio absoluto
El cambio con respecto al valor anterior
1 ene 1963 año
3.513
+3.513
0.0%
1 ene 1964 año
2.618
-0.895
-25.47%
1 ene 1965 año
2.685
+0.067
2.55%
1 ene 1966 año
2.779
+0.094
3.51%
1 ene 1967 año
2.777
-0.002
-0.07%
1 ene 1968 año
2.691
-0.087
-3.12%
1 ene 1969 año
2.671
-0.019
-0.72%
1 ene 1970 año
2.529
-0.142
-5.3%
1 ene 1971 año
2.812
+0.283
11.18%
1 ene 1972 año
1.955
-0.858
-30.5%
1 ene 1973 año
1.417
-0.538
-27.53%
1 ene 1974 año
1.597
+0.18
12.73%
1 ene 1975 año
1.977
+0.38
23.82%
1 ene 1976 año
1.745
-0.232
-11.75%
1 ene 1977 año
2.007
+0.262
15.04%
1 ene 1978 año
2.127
+0.119
5.93%
1 ene 1979 año
1.965
-0.162
-7.6%
1 ene 1980 año
2.013
+0.047
2.42%
1 ene 1981 año
1.569
-0.444
-22.06%
1 ene 1982 año
1.537
-0.032
-2.01%
1 ene 1983 año
1.306
-0.231
-15.02%
1 ene 1984 año
1.235
-0.071
-5.45%
1 ene 1985 año
1.02
-0.215
-17.39%
1 ene 1986 año
1.077
+0.057
5.6%
1 ene 1987 año
0.881
-0.197
-18.26%
1 ene 1988 año
1.175
+0.294
33.42%
1 ene 1989 año
1.773
+0.598
50.91%
1 ene 1990 año
2.903
+1.13
63.73%
1 ene 1991 año
2.907
+0.004
0.13%
1 ene 1992 año
2.495
-0.412
-14.16%
1 ene 1993 año
2.127
-0.368
-14.75%
1 ene 1994 año
2.062
-0.065
-3.05%
1 ene 1995 año
1.927
-0.135
-6.57%
1 ene 1996 año
1.828
-0.098
-5.11%
1 ene 1997 año
1.42
-0.408
-22.32%
1 ene 1998 año
1.415
-0.005
-0.35%
1 ene 1999 año
1.413
-0.002
-0.17%
1 ene 2000 año
1.493
+0.08
5.68%
1 ene 2001 año
1.888
+0.395
26.45%
1 ene 2002 año
1.784
-0.104
-5.5%
1 ene 2003 año
1.641
-0.143
-8.02%
1 ene 2004 año
1.571
-0.07
-4.27%
1 ene 2005 año
1.86
+0.289
18.4%
1 ene 2006 año
2.821
+0.961
51.65%
1 ene 2007 año
3.828
+1.008
35.72%
1 ene 2008 año
3.726
-0.102
-2.66%
1 ene 2009 año
3.206
-0.52
-13.95%
1 ene 2010 año
2.904
-0.302
-9.42%
1 ene 2011 año
3.529
+0.625
21.51%
1 ene 2012 año
3.247
-0.282
-8.0%
1 ene 2013 año
2.881
-0.366
-11.26%
1 ene 2014 año
2.348
-0.533
-18.5%
1 ene 2015 año
2.265
-0.083
-3.54%
1 ene 2016 año
2.148
-0.117
-5.16%
Ranking de los países por los datos estadísticos actuales


Comentarios: