29
/es/
es
AIzaSyAYiBZKx7MnpbEhh9jyipgxe19OcubqV5w
April 1, 2024
232101
Samoa
WSM
true
2
1
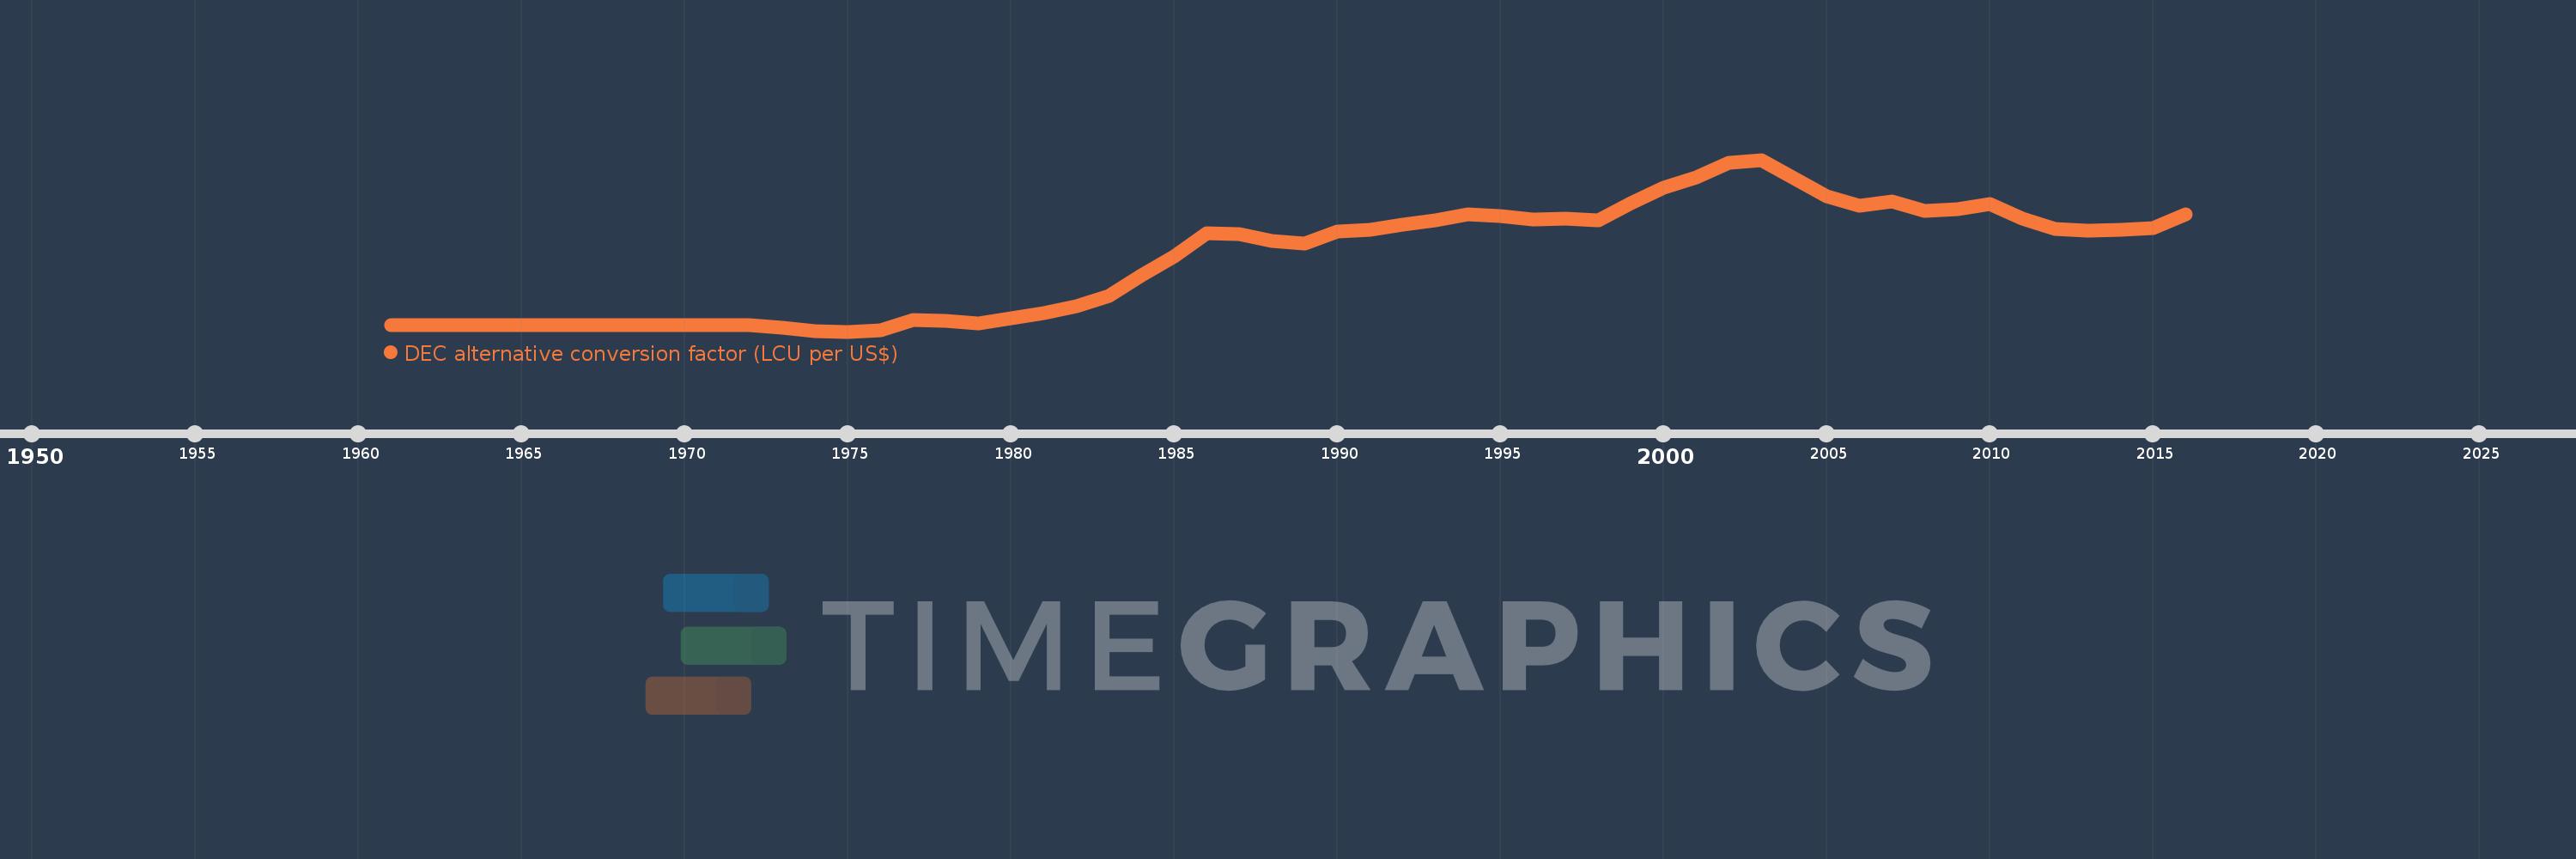
DEC alternative conversion factor (LCU per US$)
2016,2015,2014,2013,2012,2011,2010,2009,2008,2007,2006,2005,2004,2003,2002,2001,2000,1999,1998,1997,1996,1995,1994,1993,1992,1991,1990,1989,1988,1987,1986,1985,1984,1983,1982,1981,1980,1979,1978,1977,1976,1975,1974,1973,1972,1971,1970,1969,1968,1967,1966,1965,1964,1963,1962,1961
Estas estadísticas en otros países:
AfghanistanAlbaniaAlgeriaAmerican SamoaAndorraAngolaAntigua and BarbudaArgentinaArmeniaArubaAustraliaAustriaAzerbaijanBahamas, TheBahrainBangladeshBarbadosBelarusBelgiumBelizeBeninBermudaBhutanBoliviaBosnia and HerzegovinaBotswanaBrazilBrunei DarussalamBulgariaBurkina FasoBurundiCabo VerdeCambodiaCameroonCanadaCayman IslandsCentral African RepublicChadChannel IslandsChileChinaColombiaComorosCongo, Dem. Rep.Congo, Rep.Costa RicaCote d'IvoireCroatiaCubaCyprusCzech RepublicDenmarkDjiboutiDominicaDominican RepublicEcuadorEgypt, Arab Rep.El SalvadorEquatorial GuineaEritreaEstoniaEthiopiaFaroe IslandsFijiFinlandFranceFrench PolynesiaGabonGambia, TheGeorgiaGermanyGhanaGreeceGreenlandGrenadaGuatemalaGuineaGuinea-BissauGuyanaHaitiHondurasHong Kong SAR, ChinaHungaryIcelandIndiaIndonesiaIran, Islamic Rep.IraqIrelandIsle of ManIsraelItalyJamaicaJapanJordanKazakhstanKenyaKiribatiKorea, Rep.KosovoKuwaitKyrgyz RepublicLao PDRLatviaLebanonLesothoLiberiaLibyaLiechtensteinLithuaniaLuxembourgMacao SAR, ChinaMacedonia, FYRMadagascarMalawiMalaysiaMaldivesMaliMaltaMarshall IslandsMauritaniaMauritiusMexicoMicronesia, Fed. Sts.MoldovaMonacoMongoliaMontenegroMoroccoMozambiqueMyanmarNamibiaNauruNepalNetherlandsNew CaledoniaNew ZealandNicaraguaNigerNigeriaNorwayOmanPakistanPalauPanamaPapua New GuineaParaguayPeruPhilippinesPolandPortugalPuerto RicoQatarRomaniaRussian FederationRwandaSamoaSan MarinoSao Tome and PrincipeSaudi ArabiaSenegalSerbiaSeychellesSierra LeoneSingaporeSlovak RepublicSloveniaSolomon IslandsSomaliaSouth AfricaSouth SudanSpainSri LankaSt. Kitts and NevisSt. LuciaSt. Vincent and the GrenadinesSudanSurinameSwazilandSwedenSwitzerlandSyrian Arab RepublicTajikistanTanzaniaThailandTimor-LesteTogoTongaTrinidad and TobagoTunisiaTurkeyTurkmenistanTuvaluUgandaUkraineUnited Arab EmiratesUnited KingdomUnited StatesUruguayUzbekistanVanuatuVenezuela, RBVietnamVirgin Islands (U.S.)West Bank and GazaYemen, Rep.ZambiaZimbabwe línea de tiempo (timeline):
En esta escala de tiempo se presenta un gráfico de 1961 y 2016 de Samoa. Los datos de 1960 están ausentes. El número de observaciones reales por fecha: 56.
Fuente (nombre):
Indicadores del desarrollo mundial
Fuente (organización):
International Monetary Fund, International Financial Statistics, supplemented by World Bank staff estimates.
Categorías:
Economy & Growth, Financial Sector
Se ha actualizado:
23 abr 2017 año
Los indicadores de los cambios de valor en los últimos años
Mínimo:
0.607
1 ene 1975 año
Máximo:
3.472
1 ene 2003 año
A la fecha de observación
Valor
Cambio absoluto
El cambio con respecto al valor anterior
1 ene 1961 año
0.714
+0.714
0.0%
1 ene 1962 año
0.716
+0.001
0.17%
1 ene 1963 año
0.719
+0.004
0.52%
1 ene 1964 año
0.719
0.0
0.0%
1 ene 1965 año
0.719
0.0
0.0%
1 ene 1966 año
0.719
0.0
0.0%
1 ene 1967 año
0.719
0.0
0.0%
1 ene 1968 año
0.72
+0.0
0.04%
1 ene 1969 año
0.721
+0.002
0.22%
1 ene 1970 año
0.721
0.0
0.0%
1 ene 1971 año
0.721
0.0
0.0%
1 ene 1972 año
0.719
-0.002
-0.26%
1 ene 1973 año
0.675
-0.044
-6.09%
1 ene 1974 año
0.615
-0.06
-8.94%
1 ene 1975 año
0.607
-0.008
-1.37%
1 ene 1976 año
0.633
+0.026
4.32%
1 ene 1977 año
0.795
+0.163
25.7%
1 ene 1978 año
0.786
-0.009
-1.17%
1 ene 1979 año
0.736
-0.05
-6.34%
1 ene 1980 año
0.826
+0.09
12.21%
1 ene 1981 año
0.919
+0.093
11.27%
1 ene 1982 año
1.034
+0.115
12.49%
1 ene 1983 año
1.207
+0.173
16.75%
1 ene 1984 año
1.549
+0.342
28.31%
1 ene 1985 año
1.862
+0.313
20.22%
1 ene 1986 año
2.245
+0.383
20.57%
1 ene 1987 año
2.236
-0.01
-0.42%
1 ene 1988 año
2.122
-0.114
-5.1%
1 ene 1989 año
2.079
-0.043
-2.02%
1 ene 1990 año
2.269
+0.19
9.12%
1 ene 1991 año
2.309
+0.041
1.8%
1 ene 1992 año
2.397
+0.088
3.81%
1 ene 1993 año
2.466
+0.069
2.86%
1 ene 1994 año
2.568
+0.102
4.14%
1 ene 1995 año
2.535
-0.033
-1.29%
1 ene 1996 año
2.473
-0.062
-2.43%
1 ene 1997 año
2.495
+0.021
0.87%
1 ene 1998 año
2.458
-0.037
-1.47%
1 ene 1999 año
2.752
+0.294
11.96%
1 ene 2000 año
3.001
+0.248
9.03%
1 ene 2001 año
3.176
+0.175
5.85%
1 ene 2002 año
3.427
+0.251
7.9%
1 ene 2003 año
3.472
+0.045
1.32%
1 ene 2004 año
3.166
-0.306
-8.82%
1 ene 2005 año
2.858
-0.308
-9.74%
1 ene 2006 año
2.71
-0.147
-5.16%
1 ene 2007 año
2.779
+0.069
2.55%
1 ene 2008 año
2.617
-0.163
-5.85%
1 ene 2009 año
2.644
+0.028
1.05%
1 ene 2010 año
2.731
+0.087
3.28%
1 ene 2011 año
2.485
-0.246
-9.01%
1 ene 2012 año
2.317
-0.167
-6.73%
1 ene 2013 año
2.292
-0.025
-1.09%
1 ene 2014 año
2.311
+0.019
0.81%
1 ene 2015 año
2.332
+0.021
0.9%
1 ene 2016 año
2.561
+0.229
9.83%
Ranking de los países por los datos estadísticos actuales


Comentarios: