29
/es/
es
AIzaSyAYiBZKx7MnpbEhh9jyipgxe19OcubqV5w
April 1, 2024
207790
Netherlands
NLD
true
2
1
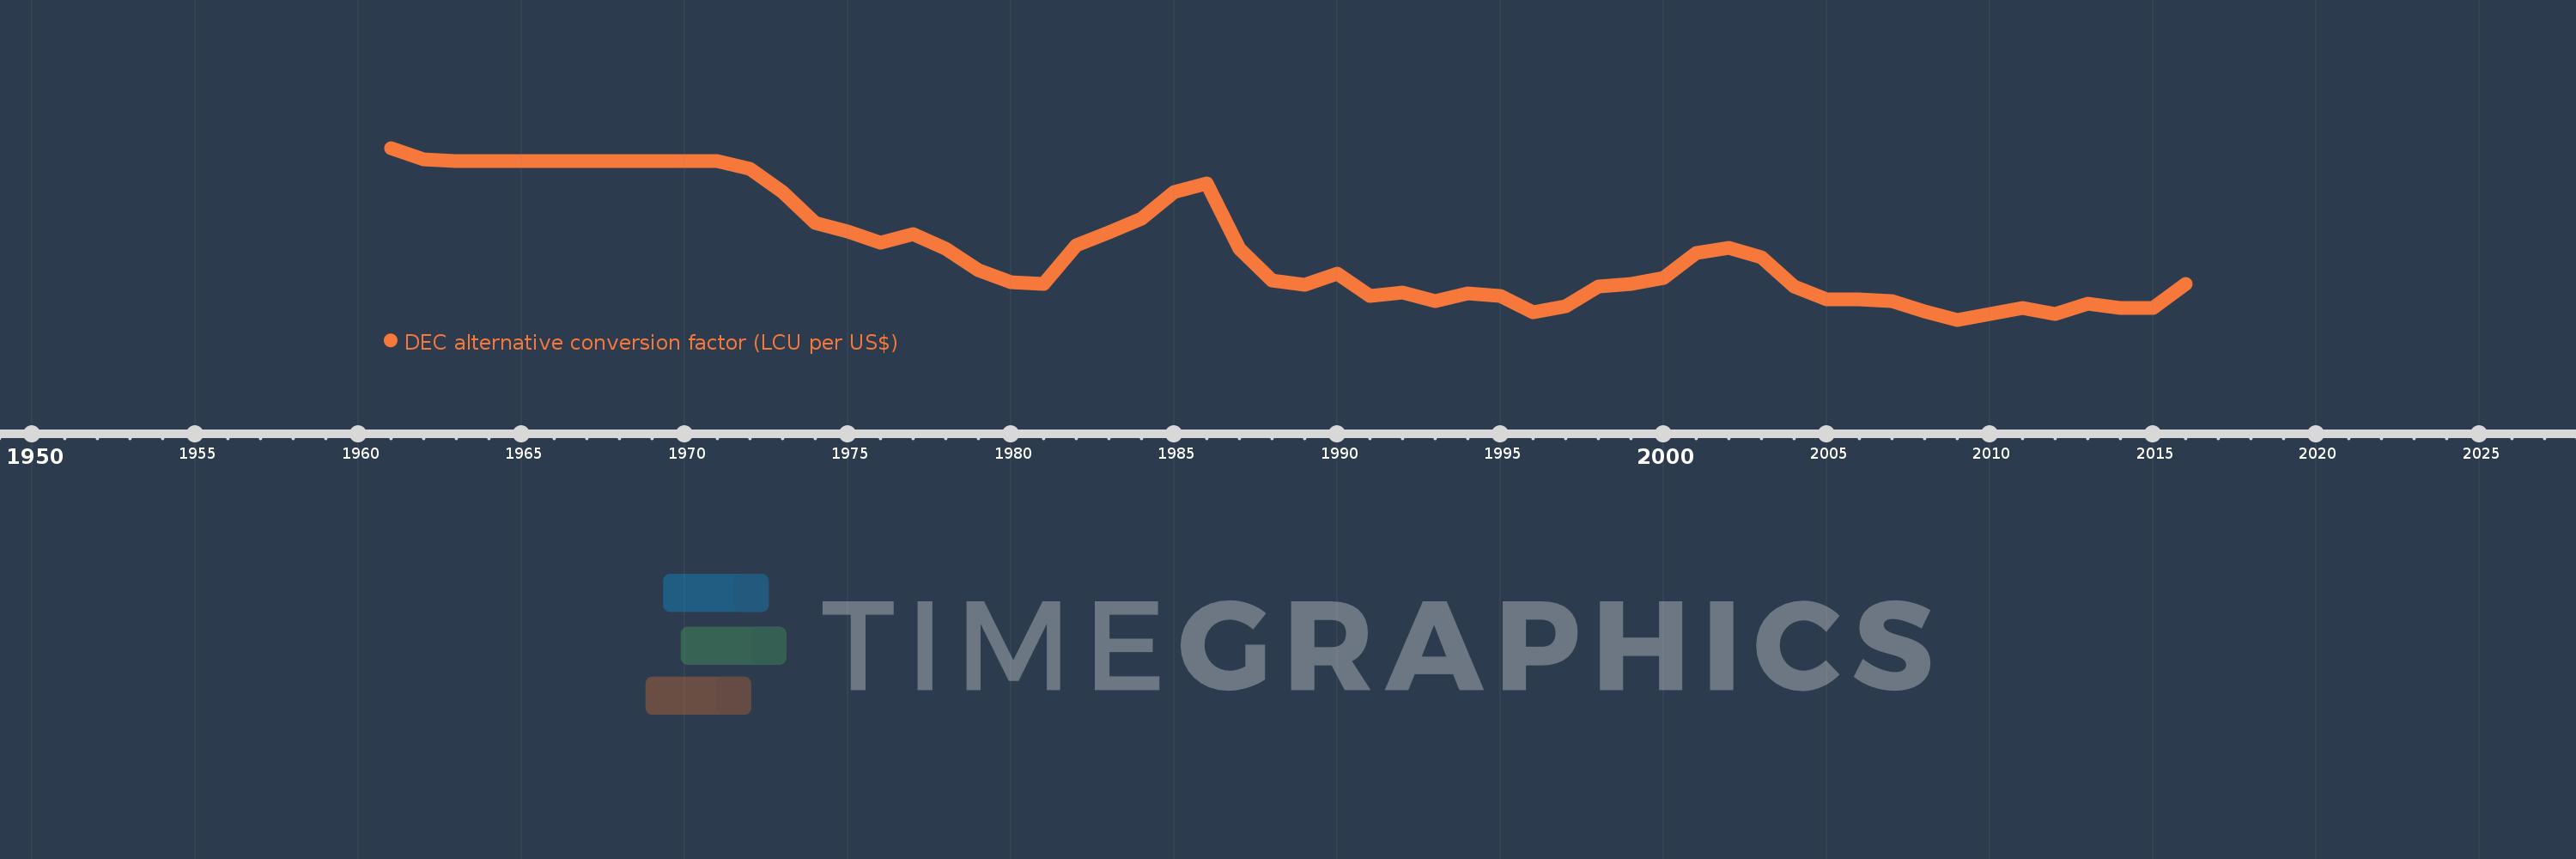
DEC alternative conversion factor (LCU per US$)
2016,2015,2014,2013,2012,2011,2010,2009,2008,2007,2006,2005,2004,2003,2002,2001,2000,1999,1998,1997,1996,1995,1994,1993,1992,1991,1990,1989,1988,1987,1986,1985,1984,1983,1982,1981,1980,1979,1978,1977,1976,1975,1974,1973,1972,1971,1970,1969,1968,1967,1966,1965,1964,1963,1962,1961
Estas estadísticas en otros países:
AfghanistanAlbaniaAlgeriaAmerican SamoaAndorraAngolaAntigua and BarbudaArgentinaArmeniaArubaAustraliaAustriaAzerbaijanBahamas, TheBahrainBangladeshBarbadosBelarusBelgiumBelizeBeninBermudaBhutanBoliviaBosnia and HerzegovinaBotswanaBrazilBrunei DarussalamBulgariaBurkina FasoBurundiCabo VerdeCambodiaCameroonCanadaCayman IslandsCentral African RepublicChadChannel IslandsChileChinaColombiaComorosCongo, Dem. Rep.Congo, Rep.Costa RicaCote d'IvoireCroatiaCubaCyprusCzech RepublicDenmarkDjiboutiDominicaDominican RepublicEcuadorEgypt, Arab Rep.El SalvadorEquatorial GuineaEritreaEstoniaEthiopiaFaroe IslandsFijiFinlandFranceFrench PolynesiaGabonGambia, TheGeorgiaGermanyGhanaGreeceGreenlandGrenadaGuatemalaGuineaGuinea-BissauGuyanaHaitiHondurasHong Kong SAR, ChinaHungaryIcelandIndiaIndonesiaIran, Islamic Rep.IraqIrelandIsle of ManIsraelItalyJamaicaJapanJordanKazakhstanKenyaKiribatiKorea, Rep.KosovoKuwaitKyrgyz RepublicLao PDRLatviaLebanonLesothoLiberiaLibyaLiechtensteinLithuaniaLuxembourgMacao SAR, ChinaMacedonia, FYRMadagascarMalawiMalaysiaMaldivesMaliMaltaMarshall IslandsMauritaniaMauritiusMexicoMicronesia, Fed. Sts.MoldovaMonacoMongoliaMontenegroMoroccoMozambiqueMyanmarNamibiaNauruNepalNetherlandsNew CaledoniaNew ZealandNicaraguaNigerNigeriaNorwayOmanPakistanPalauPanamaPapua New GuineaParaguayPeruPhilippinesPolandPortugalPuerto RicoQatarRomaniaRussian FederationRwandaSamoaSan MarinoSao Tome and PrincipeSaudi ArabiaSenegalSerbiaSeychellesSierra LeoneSingaporeSlovak RepublicSloveniaSolomon IslandsSomaliaSouth AfricaSouth SudanSpainSri LankaSt. Kitts and NevisSt. LuciaSt. Vincent and the GrenadinesSudanSurinameSwazilandSwedenSwitzerlandSyrian Arab RepublicTajikistanTanzaniaThailandTimor-LesteTogoTongaTrinidad and TobagoTunisiaTurkeyTurkmenistanTuvaluUgandaUkraineUnited Arab EmiratesUnited KingdomUnited StatesUruguayUzbekistanVanuatuVenezuela, RBVietnamVirgin Islands (U.S.)West Bank and GazaYemen, Rep.ZambiaZimbabwe línea de tiempo (timeline):
En esta escala de tiempo se presenta un gráfico de 1961 y 2016 de Netherlands. Los datos de 1960 están ausentes. El número de observaciones reales por fecha: 56.
Fuente (nombre):
Indicadores del desarrollo mundial
Fuente (organización):
International Monetary Fund, International Financial Statistics, supplemented by World Bank staff estimates.
Categorías:
Economy & Growth, Financial Sector
Se ha actualizado:
23 abr 2017 año
Los indicadores de los cambios de valor en los últimos años
Mínimo:
0.683
1 ene 2009 año
Máximo:
1.724
1 ene 1961 año
A la fecha de observación
Valor
Cambio absoluto
El cambio con respecto al valor anterior
1 ene 1961 año
1.724
+1.724
0.0%
1 ene 1962 año
1.656
-0.068
-3.95%
1 ene 1963 año
1.643
-0.014
-0.82%
1 ene 1964 año
1.643
0.0
0.0%
1 ene 1965 año
1.643
0.0
0.0%
1 ene 1966 año
1.643
0.0
0.0%
1 ene 1967 año
1.643
0.0
0.0%
1 ene 1968 año
1.643
0.0
0.0%
1 ene 1969 año
1.643
0.0
0.0%
1 ene 1970 año
1.643
0.0
0.0%
1 ene 1971 año
1.643
+0.0
0.0%
1 ene 1972 año
1.596
-0.047
-2.84%
1 ene 1973 año
1.456
-0.14
-8.75%
1 ene 1974 año
1.269
-0.188
-12.89%
1 ene 1975 año
1.22
-0.049
-3.84%
1 ene 1976 año
1.148
-0.072
-5.93%
1 ene 1977 año
1.2
+0.052
4.55%
1 ene 1978 año
1.114
-0.086
-7.18%
1 ene 1979 año
0.982
-0.132
-11.84%
1 ene 1980 año
0.91
-0.072
-7.28%
1 ene 1981 año
0.902
-0.008
-0.89%
1 ene 1982 año
1.132
+0.23
25.5%
1 ene 1983 año
1.212
+0.079
7.01%
1 ene 1984 año
1.295
+0.083
6.88%
1 ene 1985 año
1.456
+0.161
12.42%
1 ene 1986 año
1.507
+0.051
3.52%
1 ene 1987 año
1.112
-0.395
-26.23%
1 ene 1988 año
0.919
-0.193
-17.32%
1 ene 1989 año
0.897
-0.022
-2.43%
1 ene 1990 año
0.962
+0.065
7.29%
1 ene 1991 año
0.826
-0.136
-14.13%
1 ene 1992 año
0.848
+0.022
2.67%
1 ene 1993 año
0.798
-0.05
-5.94%
1 ene 1994 año
0.843
+0.045
5.61%
1 ene 1995 año
0.826
-0.017
-2.01%
1 ene 1996 año
0.729
-0.097
-11.78%
1 ene 1997 año
0.765
+0.036
5.0%
1 ene 1998 año
0.885
+0.12
15.74%
1 ene 1999 año
0.9
+0.015
1.67%
1 ene 2000 año
0.939
+0.038
4.27%
1 ene 2001 año
1.085
+0.147
15.64%
1 ene 2002 año
1.117
+0.032
2.96%
1 ene 2003 año
1.063
-0.055
-4.91%
1 ene 2004 año
0.886
-0.177
-16.62%
1 ene 2005 año
0.805
-0.081
-9.1%
1 ene 2006 año
0.804
-0.001
-0.16%
1 ene 2007 año
0.797
-0.007
-0.87%
1 ene 2008 año
0.731
-0.067
-8.34%
1 ene 2009 año
0.683
-0.048
-6.56%
1 ene 2010 año
0.72
+0.037
5.43%
1 ene 2011 año
0.755
+0.035
4.89%
1 ene 2012 año
0.719
-0.036
-4.72%
1 ene 2013 año
0.778
+0.059
8.19%
1 ene 2014 año
0.753
-0.025
-3.23%
1 ene 2015 año
0.754
+0.001
0.08%
1 ene 2016 año
0.902
+0.148
19.63%
Ranking de los países por los datos estadísticos actuales


Comentarios: