29
/es/
es
AIzaSyAYiBZKx7MnpbEhh9jyipgxe19OcubqV5w
April 1, 2024
162393
Jamaica
JAM
true
2
1
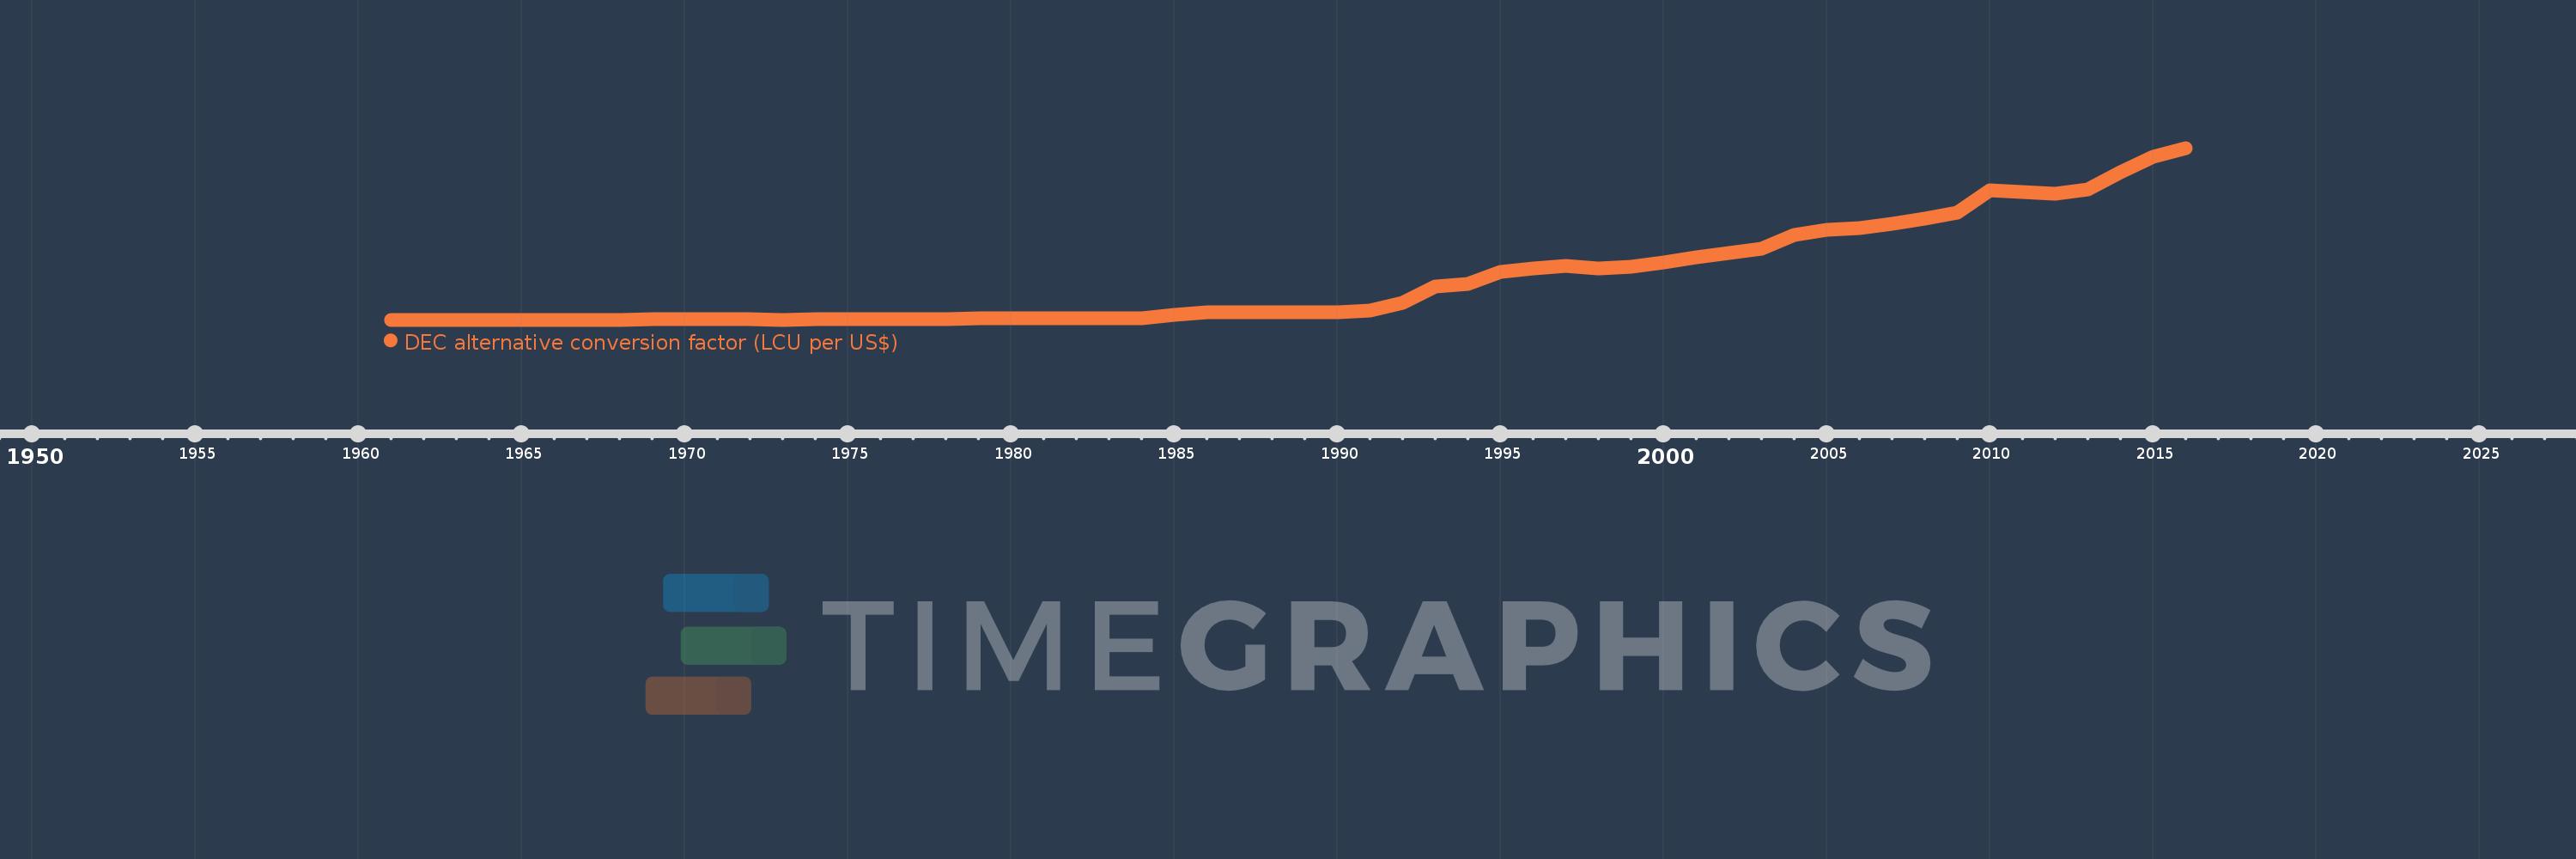
DEC alternative conversion factor (LCU per US$)
2016,2015,2014,2013,2012,2011,2010,2009,2008,2007,2006,2005,2004,2003,2002,2001,2000,1999,1998,1997,1996,1995,1994,1993,1992,1991,1990,1989,1988,1987,1986,1985,1984,1983,1982,1981,1980,1979,1978,1977,1976,1975,1974,1973,1972,1971,1970,1969,1968,1967,1966,1965,1964,1963,1962,1961
Estas estadísticas en otros países:
AfghanistanAlbaniaAlgeriaAmerican SamoaAndorraAngolaAntigua and BarbudaArgentinaArmeniaArubaAustraliaAustriaAzerbaijanBahamas, TheBahrainBangladeshBarbadosBelarusBelgiumBelizeBeninBermudaBhutanBoliviaBosnia and HerzegovinaBotswanaBrazilBrunei DarussalamBulgariaBurkina FasoBurundiCabo VerdeCambodiaCameroonCanadaCayman IslandsCentral African RepublicChadChannel IslandsChileChinaColombiaComorosCongo, Dem. Rep.Congo, Rep.Costa RicaCote d'IvoireCroatiaCubaCyprusCzech RepublicDenmarkDjiboutiDominicaDominican RepublicEcuadorEgypt, Arab Rep.El SalvadorEquatorial GuineaEritreaEstoniaEthiopiaFaroe IslandsFijiFinlandFranceFrench PolynesiaGabonGambia, TheGeorgiaGermanyGhanaGreeceGreenlandGrenadaGuatemalaGuineaGuinea-BissauGuyanaHaitiHondurasHong Kong SAR, ChinaHungaryIcelandIndiaIndonesiaIran, Islamic Rep.IraqIrelandIsle of ManIsraelItalyJamaicaJapanJordanKazakhstanKenyaKiribatiKorea, Rep.KosovoKuwaitKyrgyz RepublicLao PDRLatviaLebanonLesothoLiberiaLibyaLiechtensteinLithuaniaLuxembourgMacao SAR, ChinaMacedonia, FYRMadagascarMalawiMalaysiaMaldivesMaliMaltaMarshall IslandsMauritaniaMauritiusMexicoMicronesia, Fed. Sts.MoldovaMonacoMongoliaMontenegroMoroccoMozambiqueMyanmarNamibiaNauruNepalNetherlandsNew CaledoniaNew ZealandNicaraguaNigerNigeriaNorwayOmanPakistanPalauPanamaPapua New GuineaParaguayPeruPhilippinesPolandPortugalPuerto RicoQatarRomaniaRussian FederationRwandaSamoaSan MarinoSao Tome and PrincipeSaudi ArabiaSenegalSerbiaSeychellesSierra LeoneSingaporeSlovak RepublicSloveniaSolomon IslandsSomaliaSouth AfricaSouth SudanSpainSri LankaSt. Kitts and NevisSt. LuciaSt. Vincent and the GrenadinesSudanSurinameSwazilandSwedenSwitzerlandSyrian Arab RepublicTajikistanTanzaniaThailandTimor-LesteTogoTongaTrinidad and TobagoTunisiaTurkeyTurkmenistanTuvaluUgandaUkraineUnited Arab EmiratesUnited KingdomUnited StatesUruguayUzbekistanVanuatuVenezuela, RBVietnamVirgin Islands (U.S.)West Bank and GazaYemen, Rep.ZambiaZimbabwe línea de tiempo (timeline):
En esta escala de tiempo se presenta un gráfico de 1961 y 2016 de Jamaica. Los datos de 1960 están ausentes. El número de observaciones reales por fecha: 56.
Fuente (nombre):
Indicadores del desarrollo mundial
Fuente (organización):
International Monetary Fund, International Financial Statistics, supplemented by World Bank staff estimates.
Categorías:
Economy & Growth, Financial Sector
Se ha actualizado:
23 abr 2017 año
Los indicadores de los cambios de valor en los últimos años
Mínimo:
0.714
1 ene 1961 año
Máximo:
116.896
1 ene 2016 año
A la fecha de observación
Valor
Cambio absoluto
El cambio con respecto al valor anterior
1 ene 1961 año
0.714
+0.714
0.0%
1 ene 1962 año
0.714
0.0
0.0%
1 ene 1963 año
0.714
0.0
0.0%
1 ene 1964 año
0.714
0.0
0.0%
1 ene 1965 año
0.714
0.0
0.0%
1 ene 1966 año
0.714
0.0
0.0%
1 ene 1967 año
0.714
0.0
0.0%
1 ene 1968 año
0.724
+0.01
1.39%
1 ene 1969 año
0.833
+0.109
15.06%
1 ene 1970 año
0.833
0.0
0.0%
1 ene 1971 año
0.833
0.0
0.0%
1 ene 1972 año
0.833
-0.001
-0.06%
1 ene 1973 año
0.767
-0.065
-7.84%
1 ene 1974 año
0.902
+0.135
17.58%
1 ene 1975 año
0.909
+0.007
0.74%
1 ene 1976 año
0.909
0.0
0.0%
1 ene 1977 año
0.909
0.0
0.0%
1 ene 1978 año
0.909
0.0
0.0%
1 ene 1979 año
1.413
+0.504
55.46%
1 ene 1980 año
1.765
+0.351
24.87%
1 ene 1981 año
1.781
+0.017
0.94%
1 ene 1982 año
1.781
0.0
0.0%
1 ene 1983 año
1.781
0.0
0.0%
1 ene 1984 año
1.932
+0.151
8.47%
1 ene 1985 año
3.943
+2.011
104.06%
1 ene 1986 año
5.559
+1.616
40.98%
1 ene 1987 año
5.478
-0.081
-1.45%
1 ene 1988 año
5.487
+0.009
0.16%
1 ene 1989 año
5.489
+0.002
0.03%
1 ene 1990 año
5.745
+0.256
4.66%
1 ene 1991 año
7.184
+1.439
25.06%
1 ene 1992 año
12.22
+5.036
70.1%
1 ene 1993 año
22.99
+10.77
88.13%
1 ene 1994 año
25.11
+2.12
9.22%
1 ene 1995 año
33.29
+8.18
32.58%
1 ene 1996 año
35.35
+2.06
6.19%
1 ene 1997 año
37.25
+1.9
5.37%
1 ene 1998 año
35.51
-1.74
-4.67%
1 ene 1999 año
36.65
+1.14
3.21%
1 ene 2000 año
39.2
+2.55
6.96%
1 ene 2001 año
43.08
+3.88
9.9%
1 ene 2002 año
46.08
+3.0
6.96%
1 ene 2003 año
48.54
+2.46
5.34%
1 ene 2004 año
57.93
+9.39
19.34%
1 ene 2005 año
61.34
+3.41
5.89%
1 ene 2006 año
62.5
+1.16
1.89%
1 ene 2007 año
65.88
+3.38
5.41%
1 ene 2008 año
69.06
+3.18
4.83%
1 ene 2009 año
72.92
+3.86
5.59%
1 ene 2010 año
88.49
+15.57
21.35%
1 ene 2011 año
87.38
-1.11
-1.25%
1 ene 2012 año
85.892
-1.487
-1.7%
1 ene 2013 año
88.751
+2.858
3.33%
1 ene 2014 año
100.241
+11.49
12.95%
1 ene 2015 año
110.934
+10.693
10.67%
1 ene 2016 año
116.896
+5.962
5.37%
Ranking de los países por los datos estadísticos actuales


Comentarios: