29
/es/
es
AIzaSyAYiBZKx7MnpbEhh9jyipgxe19OcubqV5w
April 1, 2024
231483
Rwanda
RWA
true
2
1
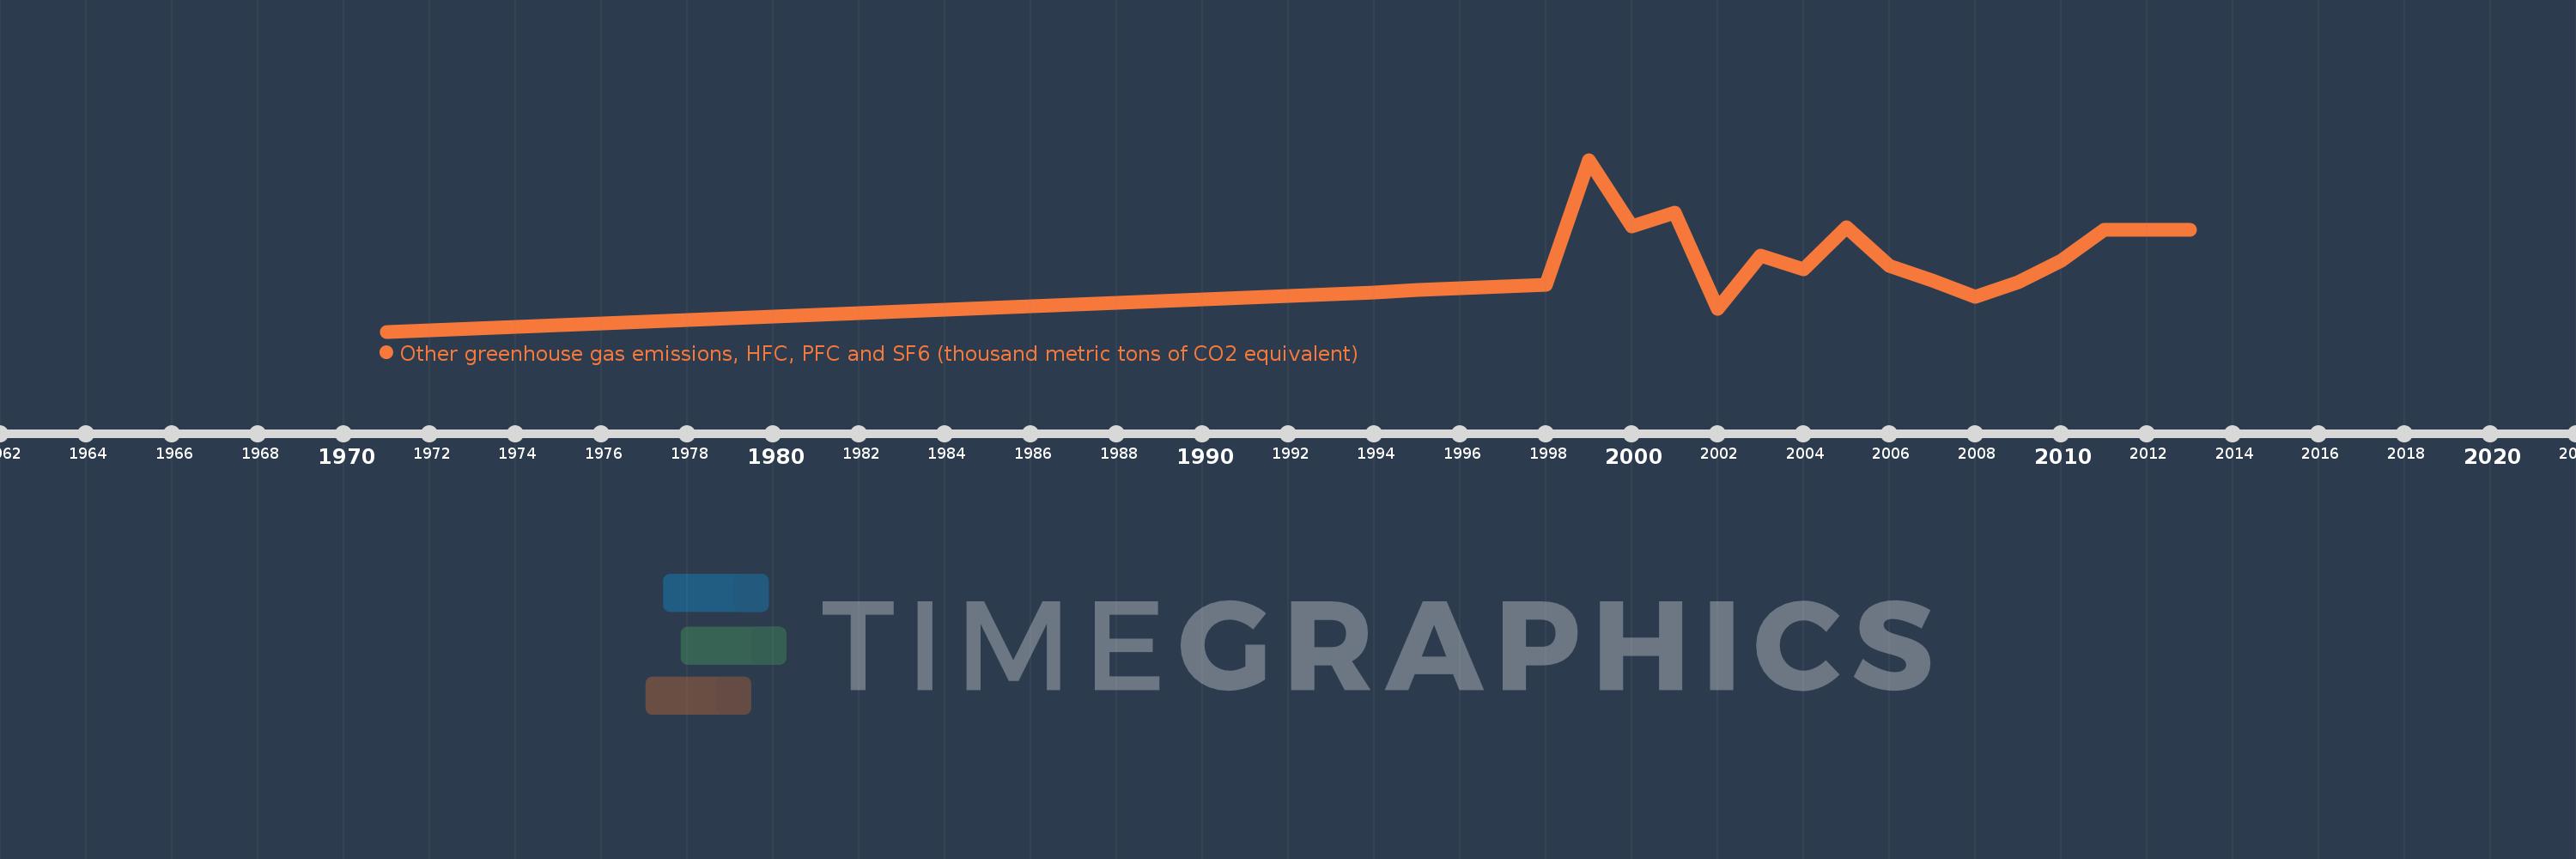
Other greenhouse gas emissions, HFC, PFC and SF6 (thousand metric tons of CO2 equivalent)
2013,2012,2011,2010,2009,2008,2007,2006,2005,2004,2003,2002,2001,2000,1999,1998,1997,1996,1995,1994,1993,1992,1991,1990,1989,1988,1987,1986,1985,1984,1983,1982,1981,1980,1979,1978,1977,1976,1975,1974,1973,1972,1971
Estas estadísticas en otros países:
AfghanistanAlbaniaAlgeriaAmerican SamoaAngolaAntigua and BarbudaArab WorldArgentinaArmeniaArubaAustraliaAustriaAzerbaijanBahamas, TheBahrainBangladeshBarbadosBelarusBelgiumBelizeBeninBermudaBhutanBoliviaBosnia and HerzegovinaBotswanaBrazilBritish Virgin IslandsBrunei DarussalamBulgariaBurkina FasoBurundiCabo VerdeCambodiaCameroonCanadaCaribbean small statesCayman IslandsCentral African RepublicCentral Europe and the BalticsChadChileChinaColombiaComorosCongo, Dem. Rep.Congo, Rep.Costa RicaCote d'IvoireCroatiaCubaCyprusCzech RepublicDenmarkDjiboutiDominicaDominican RepublicEarly-demographic dividendEast Asia & PacificEast Asia & Pacific (excluding high income)East Asia & Pacific (IDA & IBRD countries)EcuadorEgypt, Arab Rep.El SalvadorEquatorial GuineaEritreaEstoniaEthiopiaEuro areaEurope & Central AsiaEurope & Central Asia (excluding high income)Europe & Central Asia (IDA & IBRD countries)European UnionFaroe IslandsFijiFinlandFragile and conflict affected situationsFranceFrench PolynesiaGabonGambia, TheGeorgiaGermanyGhanaGibraltarGreeceGreenlandGrenadaGuamGuatemalaGuineaGuinea-BissauGuyanaHaitiHeavily indebted poor countries (HIPC)High incomeHondurasHong Kong SAR, ChinaHungaryIBRD onlyIcelandIDA & IBRD totalIDA blendIDA onlyIDA totalIndiaIndonesiaIran, Islamic Rep.IraqIrelandIsraelItalyJamaicaJapanJordanKazakhstanKenyaKiribatiKorea, Dem. People’s Rep.Korea, Rep.KuwaitKyrgyz RepublicLao PDRLate-demographic dividendLatin America & Caribbean Latin America & Caribbean (excluding high income)Latin America & the Caribbean (IDA & IBRD countries)LatviaLeast developed countries: UN classificationLebanonLesothoLiberiaLibyaLithuaniaLow & middle incomeLow incomeLower middle incomeLuxembourgMacao SAR, ChinaMacedonia, FYRMadagascarMalawiMalaysiaMaldivesMaliMaltaMauritaniaMauritiusMexicoMiddle East & North AfricaMiddle East & North Africa (excluding high income)Middle East & North Africa (IDA & IBRD countries)Middle incomeMoldovaMongoliaMoroccoMozambiqueMyanmarNamibiaNauruNepalNetherlandsNew CaledoniaNew ZealandNicaraguaNigerNigeriaNorth AmericaNorwayOECD membersOmanOther small statesPacific island small statesPakistanPanamaPapua New GuineaParaguayPeruPhilippinesPolandPortugalPost-demographic dividendPre-demographic dividendPuerto RicoQatarRomaniaRussian FederationRwandaSamoaSao Tome and PrincipeSaudi ArabiaSenegalSeychellesSierra LeoneSingaporeSlovak RepublicSloveniaSmall statesSolomon IslandsSomaliaSouth AfricaSouth AsiaSouth Asia (IDA & IBRD)SpainSri LankaSt. Kitts and NevisSt. LuciaSt. Vincent and the GrenadinesSub-Saharan Africa Sub-Saharan Africa (excluding high income)Sub-Saharan Africa (IDA & IBRD countries)SudanSurinameSwazilandSwedenSwitzerlandSyrian Arab RepublicTajikistanTanzaniaThailandTimor-LesteTogoTongaTrinidad and TobagoTunisiaTurkeyTurkmenistanTurks and Caicos IslandsTuvaluUgandaUkraineUnited Arab EmiratesUnited KingdomUnited StatesUpper middle incomeUruguayUzbekistanVanuatuVenezuela, RBVietnamVirgin Islands (U.S.)WorldYemen, Rep.ZambiaZimbabwe línea de tiempo (timeline):
En esta escala de tiempo se presenta un gráfico de 1971 y 2013 de Rwanda. Los datos de 1970 están ausentes. El número de observaciones reales por fecha: 43.
Fuente (nombre):
Indicadores del desarrollo mundial
Fuente (organización):
World Bank staff estimates from original source: European Commission, Joint Research Centre (JRC)/Netherlands Environmental Assessment Agency (PBL). Emission Database for Global Atmospheric Research (EDGAR): http://edgar.jrc.ec.europa.eu/.
Categorías:
Climate Change, Environment
Se ha actualizado:
23 abr 2017 año
Los indicadores de los cambios de valor en los últimos años
Máximo:
2.105 mil
1 ene 1999 año
A la fecha de observación
Valor
Cambio absoluto
El cambio con respecto al valor anterior
1 ene 1971 año
0.0
0.0
0.0%
1 ene 1972 año
20.8
+20.8
-18295.87 billones%
1 ene 1973 año
41.6
+20.8
100.0%
1 ene 1974 año
62.4
+20.8
50.0%
1 ene 1975 año
83.2
+20.8
33.33%
1 ene 1976 año
104.0
+20.8
25.0%
1 ene 1977 año
124.8
+20.8
20.0%
1 ene 1978 año
145.6
+20.8
16.67%
1 ene 1979 año
166.4
+20.8
14.29%
1 ene 1980 año
187.2
+20.8
12.5%
1 ene 1981 año
208.0
+20.8
11.11%
1 ene 1982 año
228.8
+20.8
10.0%
1 ene 1983 año
249.6
+20.8
9.09%
1 ene 1984 año
270.4
+20.8
8.33%
1 ene 1985 año
291.2
+20.8
7.69%
1 ene 1986 año
312.0
+20.8
7.14%
1 ene 1987 año
332.8
+20.8
6.67%
1 ene 1988 año
353.6
+20.8
6.25%
1 ene 1989 año
374.4
+20.8
5.88%
1 ene 1990 año
395.2
+20.8
5.56%
1 ene 1991 año
416.005
+20.805
5.26%
1 ene 1992 año
438.465
+22.461
5.4%
1 ene 1993 año
460.948
+22.482
5.13%
1 ene 1994 año
483.502
+22.554
4.89%
1 ene 1995 año
505.856
+22.354
4.62%
1 ene 1996 año
528.499
+22.643
4.48%
1 ene 1997 año
551.155
+22.656
4.29%
1 ene 1998 año
573.829
+22.674
4.11%
1 ene 1999 año
2.105 mil
+1.531 mil
266.84%
1 ene 2000 año
1.29 mil
-815.53
-38.74%
1 ene 2001 año
1.461 mil
+171.17
13.27%
1 ene 2002 año
274.46
-1.186 mil
-81.21%
1 ene 2003 año
927.3
+652.84
237.86%
1 ene 2004 año
762.515
-164.785
-17.77%
1 ene 2005 año
1.279 mil
+516.275
67.71%
1 ene 2006 año
799.991
-478.799
-37.44%
1 ene 2007 año
628.747
-171.244
-21.41%
1 ene 2008 año
427.0
-201.747
-32.09%
1 ene 2009 año
604.813
+177.813
41.64%
1 ene 2010 año
870.966
+266.153
44.01%
1 ene 2011 año
1.242 mil
+371.054
42.6%
1 ene 2012 año
1.242 mil
0.0
0.0%
1 ene 2013 año
1.242 mil
0.0
0.0%
Ranking de los países por los datos estadísticos actuales


Comentarios: