29
/es/
es
AIzaSyAYiBZKx7MnpbEhh9jyipgxe19OcubqV5w
April 1, 2024
170337
Korea, Rep.
KOR
true
2
1
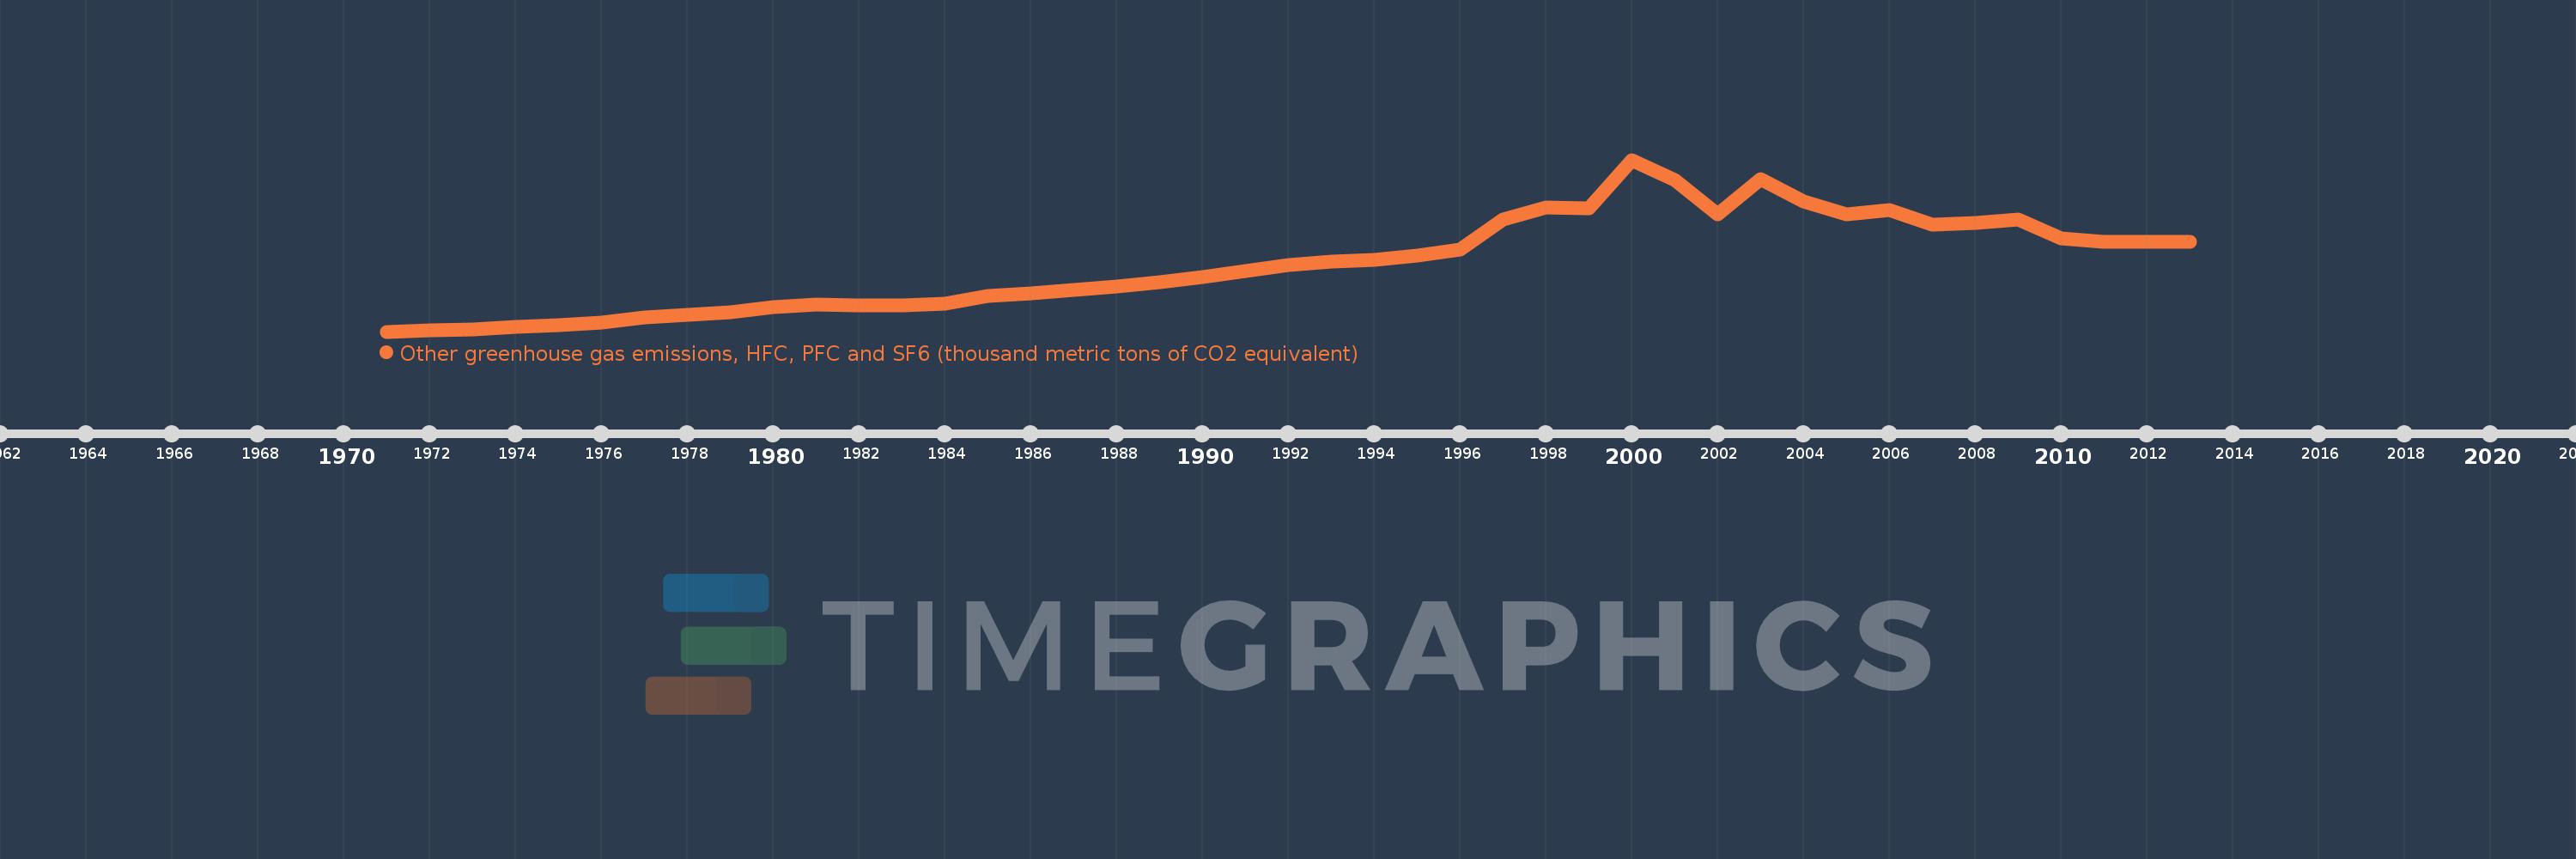
Other greenhouse gas emissions, HFC, PFC and SF6 (thousand metric tons of CO2 equivalent)
2013,2012,2011,2010,2009,2008,2007,2006,2005,2004,2003,2002,2001,2000,1999,1998,1997,1996,1995,1994,1993,1992,1991,1990,1989,1988,1987,1986,1985,1984,1983,1982,1981,1980,1979,1978,1977,1976,1975,1974,1973,1972,1971
Estas estadísticas en otros países:
AfghanistanAlbaniaAlgeriaAmerican SamoaAngolaAntigua and BarbudaArab WorldArgentinaArmeniaArubaAustraliaAustriaAzerbaijanBahamas, TheBahrainBangladeshBarbadosBelarusBelgiumBelizeBeninBermudaBhutanBoliviaBosnia and HerzegovinaBotswanaBrazilBritish Virgin IslandsBrunei DarussalamBulgariaBurkina FasoBurundiCabo VerdeCambodiaCameroonCanadaCaribbean small statesCayman IslandsCentral African RepublicCentral Europe and the BalticsChadChileChinaColombiaComorosCongo, Dem. Rep.Congo, Rep.Costa RicaCote d'IvoireCroatiaCubaCyprusCzech RepublicDenmarkDjiboutiDominicaDominican RepublicEarly-demographic dividendEast Asia & PacificEast Asia & Pacific (excluding high income)East Asia & Pacific (IDA & IBRD countries)EcuadorEgypt, Arab Rep.El SalvadorEquatorial GuineaEritreaEstoniaEthiopiaEuro areaEurope & Central AsiaEurope & Central Asia (excluding high income)Europe & Central Asia (IDA & IBRD countries)European UnionFaroe IslandsFijiFinlandFragile and conflict affected situationsFranceFrench PolynesiaGabonGambia, TheGeorgiaGermanyGhanaGibraltarGreeceGreenlandGrenadaGuamGuatemalaGuineaGuinea-BissauGuyanaHaitiHeavily indebted poor countries (HIPC)High incomeHondurasHong Kong SAR, ChinaHungaryIBRD onlyIcelandIDA & IBRD totalIDA blendIDA onlyIDA totalIndiaIndonesiaIran, Islamic Rep.IraqIrelandIsraelItalyJamaicaJapanJordanKazakhstanKenyaKiribatiKorea, Dem. People’s Rep.Korea, Rep.KuwaitKyrgyz RepublicLao PDRLate-demographic dividendLatin America & Caribbean Latin America & Caribbean (excluding high income)Latin America & the Caribbean (IDA & IBRD countries)LatviaLeast developed countries: UN classificationLebanonLesothoLiberiaLibyaLithuaniaLow & middle incomeLow incomeLower middle incomeLuxembourgMacao SAR, ChinaMacedonia, FYRMadagascarMalawiMalaysiaMaldivesMaliMaltaMauritaniaMauritiusMexicoMiddle East & North AfricaMiddle East & North Africa (excluding high income)Middle East & North Africa (IDA & IBRD countries)Middle incomeMoldovaMongoliaMoroccoMozambiqueMyanmarNamibiaNauruNepalNetherlandsNew CaledoniaNew ZealandNicaraguaNigerNigeriaNorth AmericaNorwayOECD membersOmanOther small statesPacific island small statesPakistanPanamaPapua New GuineaParaguayPeruPhilippinesPolandPortugalPost-demographic dividendPre-demographic dividendPuerto RicoQatarRomaniaRussian FederationRwandaSamoaSao Tome and PrincipeSaudi ArabiaSenegalSeychellesSierra LeoneSingaporeSlovak RepublicSloveniaSmall statesSolomon IslandsSomaliaSouth AfricaSouth AsiaSouth Asia (IDA & IBRD)SpainSri LankaSt. Kitts and NevisSt. LuciaSt. Vincent and the GrenadinesSub-Saharan Africa Sub-Saharan Africa (excluding high income)Sub-Saharan Africa (IDA & IBRD countries)SudanSurinameSwazilandSwedenSwitzerlandSyrian Arab RepublicTajikistanTanzaniaThailandTimor-LesteTogoTongaTrinidad and TobagoTunisiaTurkeyTurkmenistanTurks and Caicos IslandsTuvaluUgandaUkraineUnited Arab EmiratesUnited KingdomUnited StatesUpper middle incomeUruguayUzbekistanVanuatuVenezuela, RBVietnamVirgin Islands (U.S.)WorldYemen, Rep.ZambiaZimbabwe línea de tiempo (timeline):
En esta escala de tiempo se presenta un gráfico de 1971 y 2013 de Korea, Rep.. Los datos de 1970 están ausentes. El número de observaciones reales por fecha: 43.
Fuente (nombre):
Indicadores del desarrollo mundial
Fuente (organización):
World Bank staff estimates from original source: European Commission, Joint Research Centre (JRC)/Netherlands Environmental Assessment Agency (PBL). Emission Database for Global Atmospheric Research (EDGAR): http://edgar.jrc.ec.europa.eu/.
Categorías:
Climate Change, Environment
Se ha actualizado:
23 abr 2017 año
Los indicadores de los cambios de valor en los últimos años
Mínimo:
385.5
1 ene 1971 año
Máximo:
16.874 mil
1 ene 2000 año
A la fecha de observación
Valor
Cambio absoluto
El cambio con respecto al valor anterior
1 ene 1971 año
385.5
+385.5
0.0%
1 ene 1972 año
488.5
+103.0
26.72%
1 ene 1973 año
567.2
+78.7
16.11%
1 ene 1974 año
797.8
+230.6
40.66%
1 ene 1975 año
978.4
+180.6
22.64%
1 ene 1976 año
1.227 mil
+248.6
25.41%
1 ene 1977 año
1.737 mil
+509.6
41.53%
1 ene 1978 año
2.0 mil
+263.6
15.18%
1 ene 1979 año
2.28 mil
+279.6
13.98%
1 ene 1980 año
2.719 mil
+439.6
19.28%
1 ene 1981 año
2.944 mil
+224.6
8.26%
1 ene 1982 año
2.877 mil
-67.4
-2.29%
1 ene 1983 año
2.938 mil
+61.6
2.14%
1 ene 1984 año
3.062 mil
+123.6
4.21%
1 ene 1985 año
3.796 mil
+734.6
23.99%
1 ene 1986 año
4.057 mil
+260.6
6.86%
1 ene 1987 año
4.376 mil
+318.6
7.85%
1 ene 1988 año
4.736 mil
+360.6
8.24%
1 ene 1989 año
5.09 mil
+353.6
7.47%
1 ene 1990 año
5.591 mil
+501.6
9.86%
1 ene 1991 año
6.165 mil
+573.6
10.26%
1 ene 1992 año
6.749 mil
+584.0
9.47%
1 ene 1993 año
7.124 mil
+375.0
5.56%
1 ene 1994 año
7.296 mil
+172.0
2.41%
1 ene 1995 año
7.642 mil
+346.0
4.74%
1 ene 1996 año
8.262 mil
+620.0
8.11%
1 ene 1997 año
11.152 mil
+2.89 mil
34.98%
1 ene 1998 año
12.322 mil
+1.17 mil
10.49%
1 ene 1999 año
12.192 mil
-130.151
-1.06%
1 ene 2000 año
16.874 mil
+4.682 mil
38.41%
1 ene 2001 año
14.934 mil
-1.94 mil
-11.5%
1 ene 2002 año
11.622 mil
-3.311 mil
-22.17%
1 ene 2003 año
15.017 mil
+3.394 mil
29.21%
1 ene 2004 año
12.858 mil
-2.159 mil
-14.38%
1 ene 2005 año
11.633 mil
-1.225 mil
-9.53%
1 ene 2006 año
12.038 mil
+405.009
3.48%
1 ene 2007 año
10.63 mil
-1.408 mil
-11.7%
1 ene 2008 año
10.779 mil
+148.791
1.4%
1 ene 2009 año
11.185 mil
+406.138
3.77%
1 ene 2010 año
9.368 mil
-1.817 mil
-16.24%
1 ene 2011 año
8.968 mil
-400.193
-4.27%
1 ene 2012 año
8.968 mil
+0.0
0.0%
1 ene 2013 año
8.968 mil
0.0
0.0%
Ranking de los países por los datos estadísticos actuales


Comentarios: