29
/es/
es
AIzaSyAYiBZKx7MnpbEhh9jyipgxe19OcubqV5w
April 1, 2024
133486
Finland
FIN
true
2
1
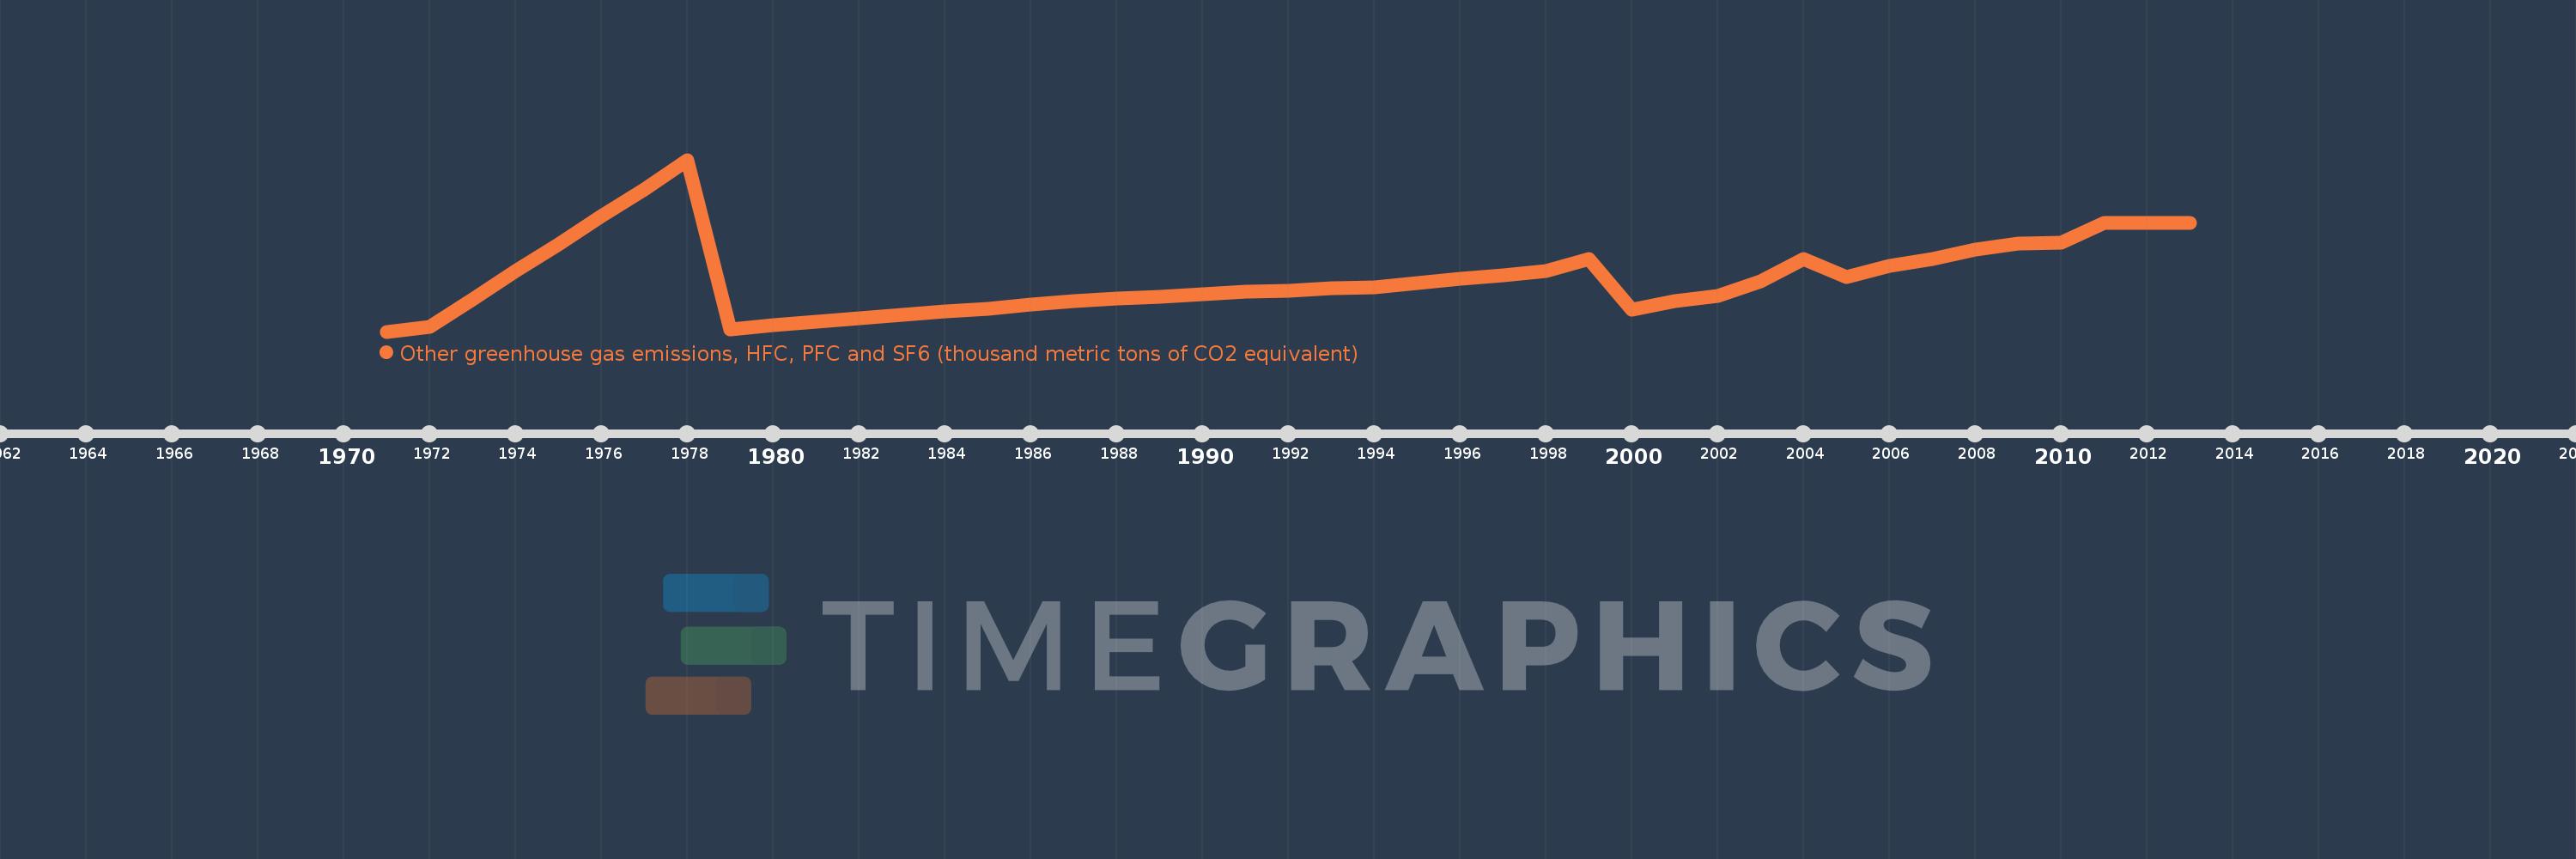
Other greenhouse gas emissions, HFC, PFC and SF6 (thousand metric tons of CO2 equivalent)
2013,2012,2011,2010,2009,2008,2007,2006,2005,2004,2003,2002,2001,2000,1999,1998,1997,1996,1995,1994,1993,1992,1991,1990,1989,1988,1987,1986,1985,1984,1983,1982,1981,1980,1979,1978,1977,1976,1975,1974,1973,1972,1971
Estas estadísticas en otros países:
AfghanistanAlbaniaAlgeriaAmerican SamoaAngolaAntigua and BarbudaArab WorldArgentinaArmeniaArubaAustraliaAustriaAzerbaijanBahamas, TheBahrainBangladeshBarbadosBelarusBelgiumBelizeBeninBermudaBhutanBoliviaBosnia and HerzegovinaBotswanaBrazilBritish Virgin IslandsBrunei DarussalamBulgariaBurkina FasoBurundiCabo VerdeCambodiaCameroonCanadaCaribbean small statesCayman IslandsCentral African RepublicCentral Europe and the BalticsChadChileChinaColombiaComorosCongo, Dem. Rep.Congo, Rep.Costa RicaCote d'IvoireCroatiaCubaCyprusCzech RepublicDenmarkDjiboutiDominicaDominican RepublicEarly-demographic dividendEast Asia & PacificEast Asia & Pacific (excluding high income)East Asia & Pacific (IDA & IBRD countries)EcuadorEgypt, Arab Rep.El SalvadorEquatorial GuineaEritreaEstoniaEthiopiaEuro areaEurope & Central AsiaEurope & Central Asia (excluding high income)Europe & Central Asia (IDA & IBRD countries)European UnionFaroe IslandsFijiFinlandFragile and conflict affected situationsFranceFrench PolynesiaGabonGambia, TheGeorgiaGermanyGhanaGibraltarGreeceGreenlandGrenadaGuamGuatemalaGuineaGuinea-BissauGuyanaHaitiHeavily indebted poor countries (HIPC)High incomeHondurasHong Kong SAR, ChinaHungaryIBRD onlyIcelandIDA & IBRD totalIDA blendIDA onlyIDA totalIndiaIndonesiaIran, Islamic Rep.IraqIrelandIsraelItalyJamaicaJapanJordanKazakhstanKenyaKiribatiKorea, Dem. People’s Rep.Korea, Rep.KuwaitKyrgyz RepublicLao PDRLate-demographic dividendLatin America & Caribbean Latin America & Caribbean (excluding high income)Latin America & the Caribbean (IDA & IBRD countries)LatviaLeast developed countries: UN classificationLebanonLesothoLiberiaLibyaLithuaniaLow & middle incomeLow incomeLower middle incomeLuxembourgMacao SAR, ChinaMacedonia, FYRMadagascarMalawiMalaysiaMaldivesMaliMaltaMauritaniaMauritiusMexicoMiddle East & North AfricaMiddle East & North Africa (excluding high income)Middle East & North Africa (IDA & IBRD countries)Middle incomeMoldovaMongoliaMoroccoMozambiqueMyanmarNamibiaNauruNepalNetherlandsNew CaledoniaNew ZealandNicaraguaNigerNigeriaNorth AmericaNorwayOECD membersOmanOther small statesPacific island small statesPakistanPanamaPapua New GuineaParaguayPeruPhilippinesPolandPortugalPost-demographic dividendPre-demographic dividendPuerto RicoQatarRomaniaRussian FederationRwandaSamoaSao Tome and PrincipeSaudi ArabiaSenegalSeychellesSierra LeoneSingaporeSlovak RepublicSloveniaSmall statesSolomon IslandsSomaliaSouth AfricaSouth AsiaSouth Asia (IDA & IBRD)SpainSri LankaSt. Kitts and NevisSt. LuciaSt. Vincent and the GrenadinesSub-Saharan Africa Sub-Saharan Africa (excluding high income)Sub-Saharan Africa (IDA & IBRD countries)SudanSurinameSwazilandSwedenSwitzerlandSyrian Arab RepublicTajikistanTanzaniaThailandTimor-LesteTogoTongaTrinidad and TobagoTunisiaTurkeyTurkmenistanTurks and Caicos IslandsTuvaluUgandaUkraineUnited Arab EmiratesUnited KingdomUnited StatesUpper middle incomeUruguayUzbekistanVanuatuVenezuela, RBVietnamVirgin Islands (U.S.)WorldYemen, Rep.ZambiaZimbabwe línea de tiempo (timeline):
En esta escala de tiempo se presenta un gráfico de 1971 y 2013 de Finland. Los datos de 1970 están ausentes. El número de observaciones reales por fecha: 43.
Fuente (nombre):
Indicadores del desarrollo mundial
Fuente (organización):
World Bank staff estimates from original source: European Commission, Joint Research Centre (JRC)/Netherlands Environmental Assessment Agency (PBL). Emission Database for Global Atmospheric Research (EDGAR): http://edgar.jrc.ec.europa.eu/.
Categorías:
Climate Change, Environment
Se ha actualizado:
23 abr 2017 año
Los indicadores de los cambios de valor en los últimos años
Mínimo:
240.215
1 ene 1971 año
Máximo:
1.897 mil
1 ene 1978 año
A la fecha de observación
Valor
Cambio absoluto
El cambio con respecto al valor anterior
1 ene 1971 año
240.215
+240.215
0.0%
1 ene 1972 año
285.464
+45.249
18.84%
1 ene 1973 año
546.948
+261.484
91.6%
1 ene 1974 año
822.751
+275.804
50.43%
1 ene 1975 año
1.083 mil
+259.947
31.59%
1 ene 1976 año
1.351 mil
+268.23
24.77%
1 ene 1977 año
1.614 mil
+262.748
19.45%
1 ene 1978 año
1.897 mil
+282.871
17.53%
1 ene 1979 año
257.028
-1.64 mil
-86.45%
1 ene 1980 año
299.084
+42.056
16.36%
1 ene 1981 año
336.793
+37.709
12.61%
1 ene 1982 año
369.476
+32.683
9.7%
1 ene 1983 año
402.63
+33.154
8.97%
1 ene 1984 año
434.945
+32.314
8.03%
1 ene 1985 año
463.421
+28.477
6.55%
1 ene 1986 año
504.238
+40.816
8.81%
1 ene 1987 año
535.019
+30.781
6.1%
1 ene 1988 año
559.661
+24.642
4.61%
1 ene 1989 año
579.252
+19.591
3.5%
1 ene 1990 año
602.068
+22.817
3.94%
1 ene 1991 año
629.331
+27.263
4.53%
1 ene 1992 año
632.139
+2.808
0.45%
1 ene 1993 año
655.576
+23.436
3.71%
1 ene 1994 año
666.564
+10.989
1.68%
1 ene 1995 año
704.678
+38.113
5.72%
1 ene 1996 año
750.692
+46.014
6.53%
1 ene 1997 año
784.871
+34.179
4.55%
1 ene 1998 año
824.21
+39.339
5.01%
1 ene 1999 año
936.93
+112.72
13.68%
1 ene 2000 año
450.8
-486.13
-51.89%
1 ene 2001 año
530.7
+79.9
17.72%
1 ene 2002 año
581.072
+50.372
9.49%
1 ene 2003 año
723.871
+142.799
24.58%
1 ene 2004 año
943.853
+219.982
30.39%
1 ene 2005 año
764.3
-179.553
-19.02%
1 ene 2006 año
870.556
+106.256
13.9%
1 ene 2007 año
943.826
+73.27
8.42%
1 ene 2008 año
1.033 mil
+89.198
9.45%
1 ene 2009 año
1.088 mil
+54.486
5.27%
1 ene 2010 año
1.094 mil
+6.871
0.63%
1 ene 2011 año
1.284 mil
+189.959
17.36%
1 ene 2012 año
1.284 mil
0.0
0.0%
1 ene 2013 año
1.284 mil
+0.0
0.0%
Ranking de los países por los datos estadísticos actuales


Comentarios: