29
/es/
es
AIzaSyAYiBZKx7MnpbEhh9jyipgxe19OcubqV5w
April 1, 2024
228418
Romania
ROU
true
2
1
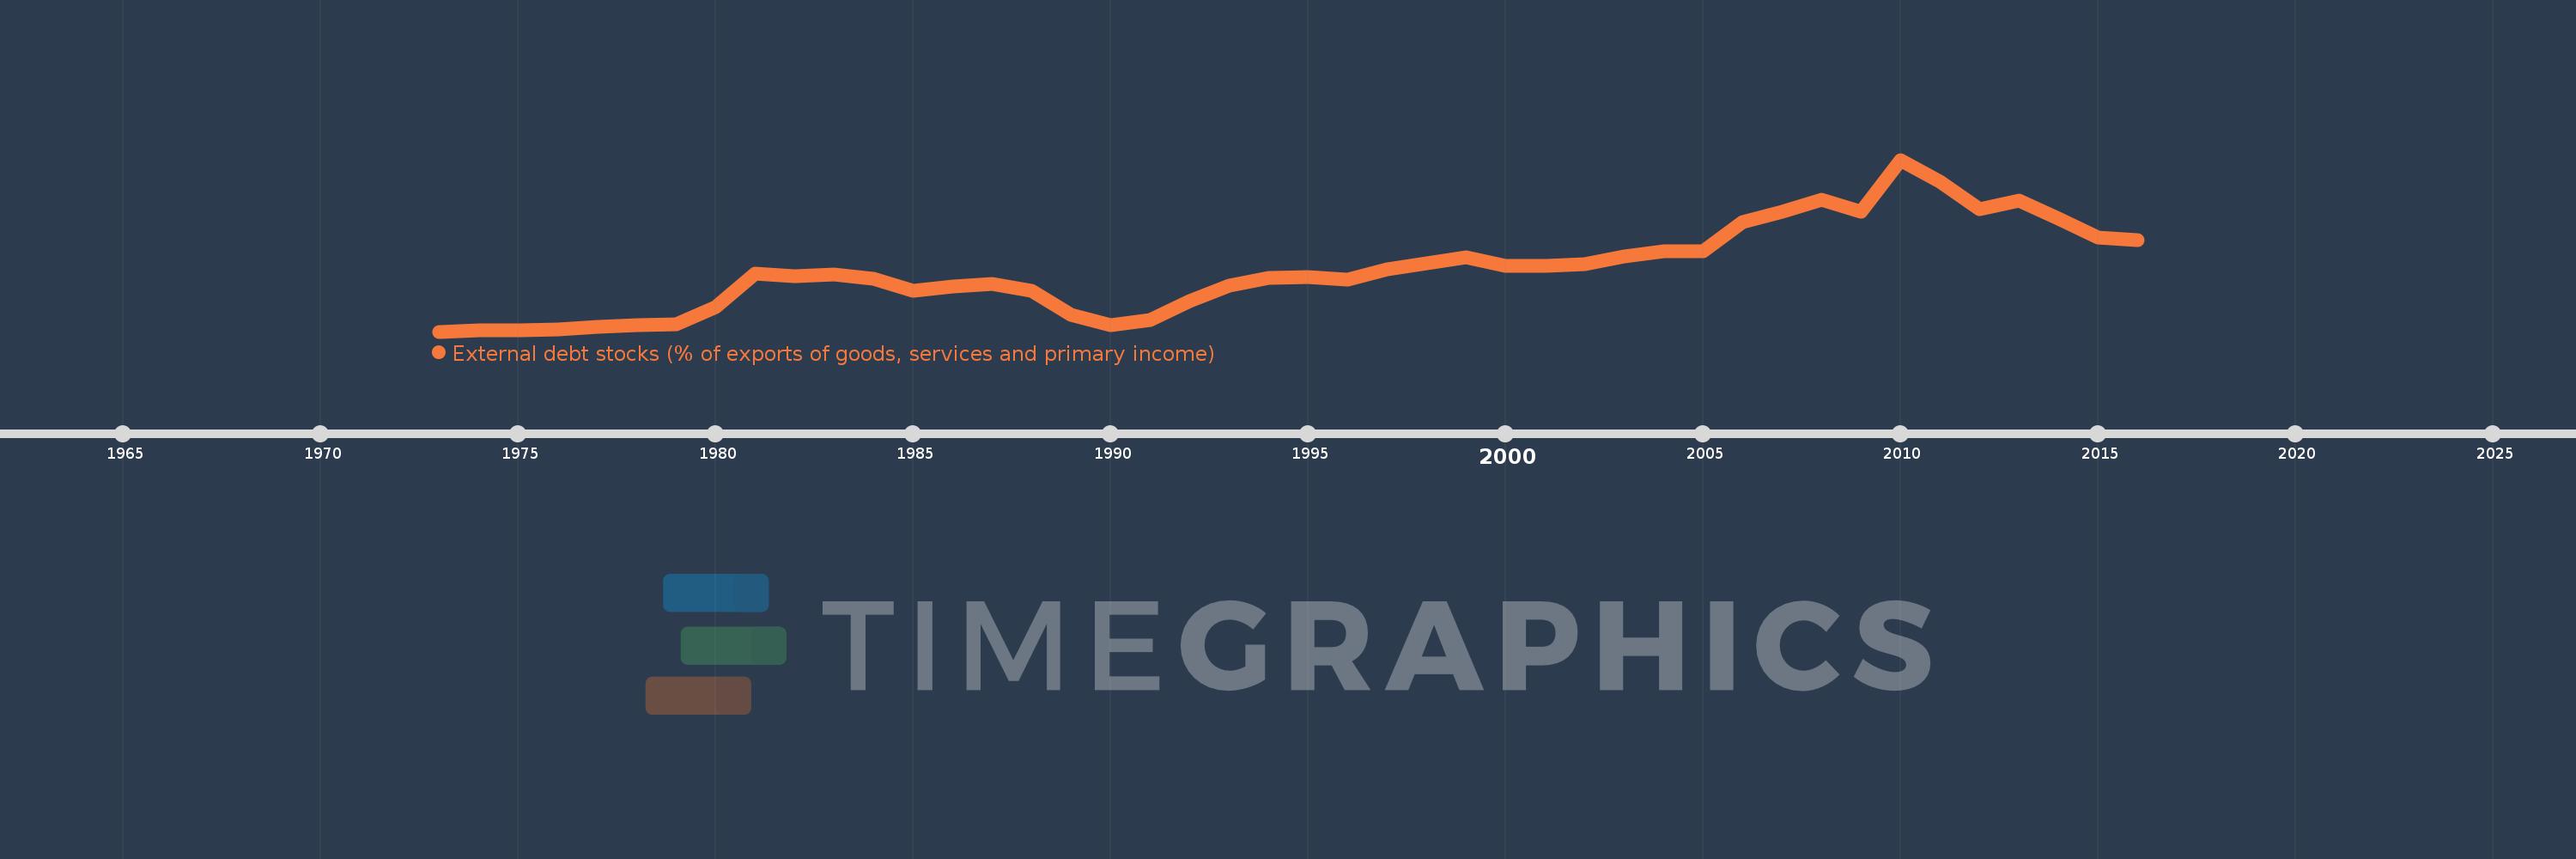
External debt stocks (% of exports of goods, services and primary income)
2016,2015,2014,2013,2012,2011,2010,2009,2008,2007,2006,2005,2004,2003,2002,2001,2000,1999,1998,1997,1996,1995,1994,1993,1992,1991,1990,1989,1988,1987,1986,1985,1984,1983,1982,1981,1980,1979,1978,1977,1976,1975,1974,1973
Estas estadísticas en otros países:
línea de tiempo (timeline):
En esta escala de tiempo se presenta un gráfico de 1973 y 2016 de Romania. Los datos de 1972 están ausentes. El número de observaciones reales por fecha: 44.
Fuente (nombre):
Indicadores del desarrollo mundial
Fuente (organización):
World Bank, International Debt Statistics.
Categorías:
Economy & Growth, External Debt
Se ha actualizado:
23 abr 2017 año
Los indicadores de los cambios de valor en los últimos años
Mínimo:
1.053
1 ene 1973 año
Máximo:
237.515
1 ene 2010 año
A la fecha de observación
Valor
Cambio absoluto
El cambio con respecto al valor anterior
1 ene 1973 año
1.053
+1.053
0.0%
1 ene 1974 año
2.709
+1.656
157.32%
1 ene 1975 año
2.621
-0.088
-3.24%
1 ene 1976 año
3.613
+0.992
37.84%
1 ene 1977 año
7.854
+4.241
117.4%
1 ene 1978 año
10.204
+2.35
29.92%
1 ene 1979 año
10.928
+0.724
7.1%
1 ene 1980 año
35.097
+24.168
221.16%
1 ene 1981 año
80.282
+45.185
128.75%
1 ene 1982 año
76.956
-3.326
-4.14%
1 ene 1983 año
80.006
+3.05
3.96%
1 ene 1984 año
73.999
-6.007
-7.51%
1 ene 1985 año
57.028
-16.97
-22.93%
1 ene 1986 año
63.501
+6.473
11.35%
1 ene 1987 año
66.105
+2.603
4.1%
1 ene 1988 año
57.724
-8.381
-12.68%
1 ene 1989 año
23.845
-33.879
-58.69%
1 ene 1990 año
9.449
-14.396
-60.37%
1 ene 1991 año
17.389
+7.94
84.03%
1 ene 1992 año
42.76
+25.371
145.9%
1 ene 1993 año
64.449
+21.689
50.72%
1 ene 1994 año
74.414
+9.965
15.46%
1 ene 1995 año
76.621
+2.207
2.97%
1 ene 1996 año
72.031
-4.591
-5.99%
1 ene 1997 año
86.922
+14.891
20.67%
1 ene 1998 año
94.868
+7.946
9.14%
1 ene 1999 año
103.236
+8.368
8.82%
1 ene 2000 año
90.927
-12.309
-11.92%
1 ene 2001 año
92.062
+1.135
1.25%
1 ene 2002 año
94.172
+2.11
2.29%
1 ene 2003 año
104.132
+9.96
10.58%
1 ene 2004 año
112.045
+7.913
7.6%
1 ene 2005 año
111.392
-0.652
-0.58%
1 ene 2006 año
152.129
+40.736
36.57%
1 ene 2007 año
166.532
+14.404
9.47%
1 ene 2008 año
182.806
+16.274
9.77%
1 ene 2009 año
165.637
-17.169
-9.39%
1 ene 2010 año
237.515
+71.878
43.4%
1 ene 2011 año
207.384
-30.131
-12.69%
1 ene 2012 año
169.428
-37.956
-18.3%
1 ene 2013 año
181.024
+11.597
6.84%
1 ene 2014 año
155.984
-25.04
-13.83%
1 ene 2015 año
131.085
-24.899
-15.96%
1 ene 2016 año
126.906
-4.179
-3.19%
Ranking de los países por los datos estadísticos actuales


Comentarios: