29
/es/
es
AIzaSyAYiBZKx7MnpbEhh9jyipgxe19OcubqV5w
April 1, 2024
149084
Haiti
HTI
true
2
1
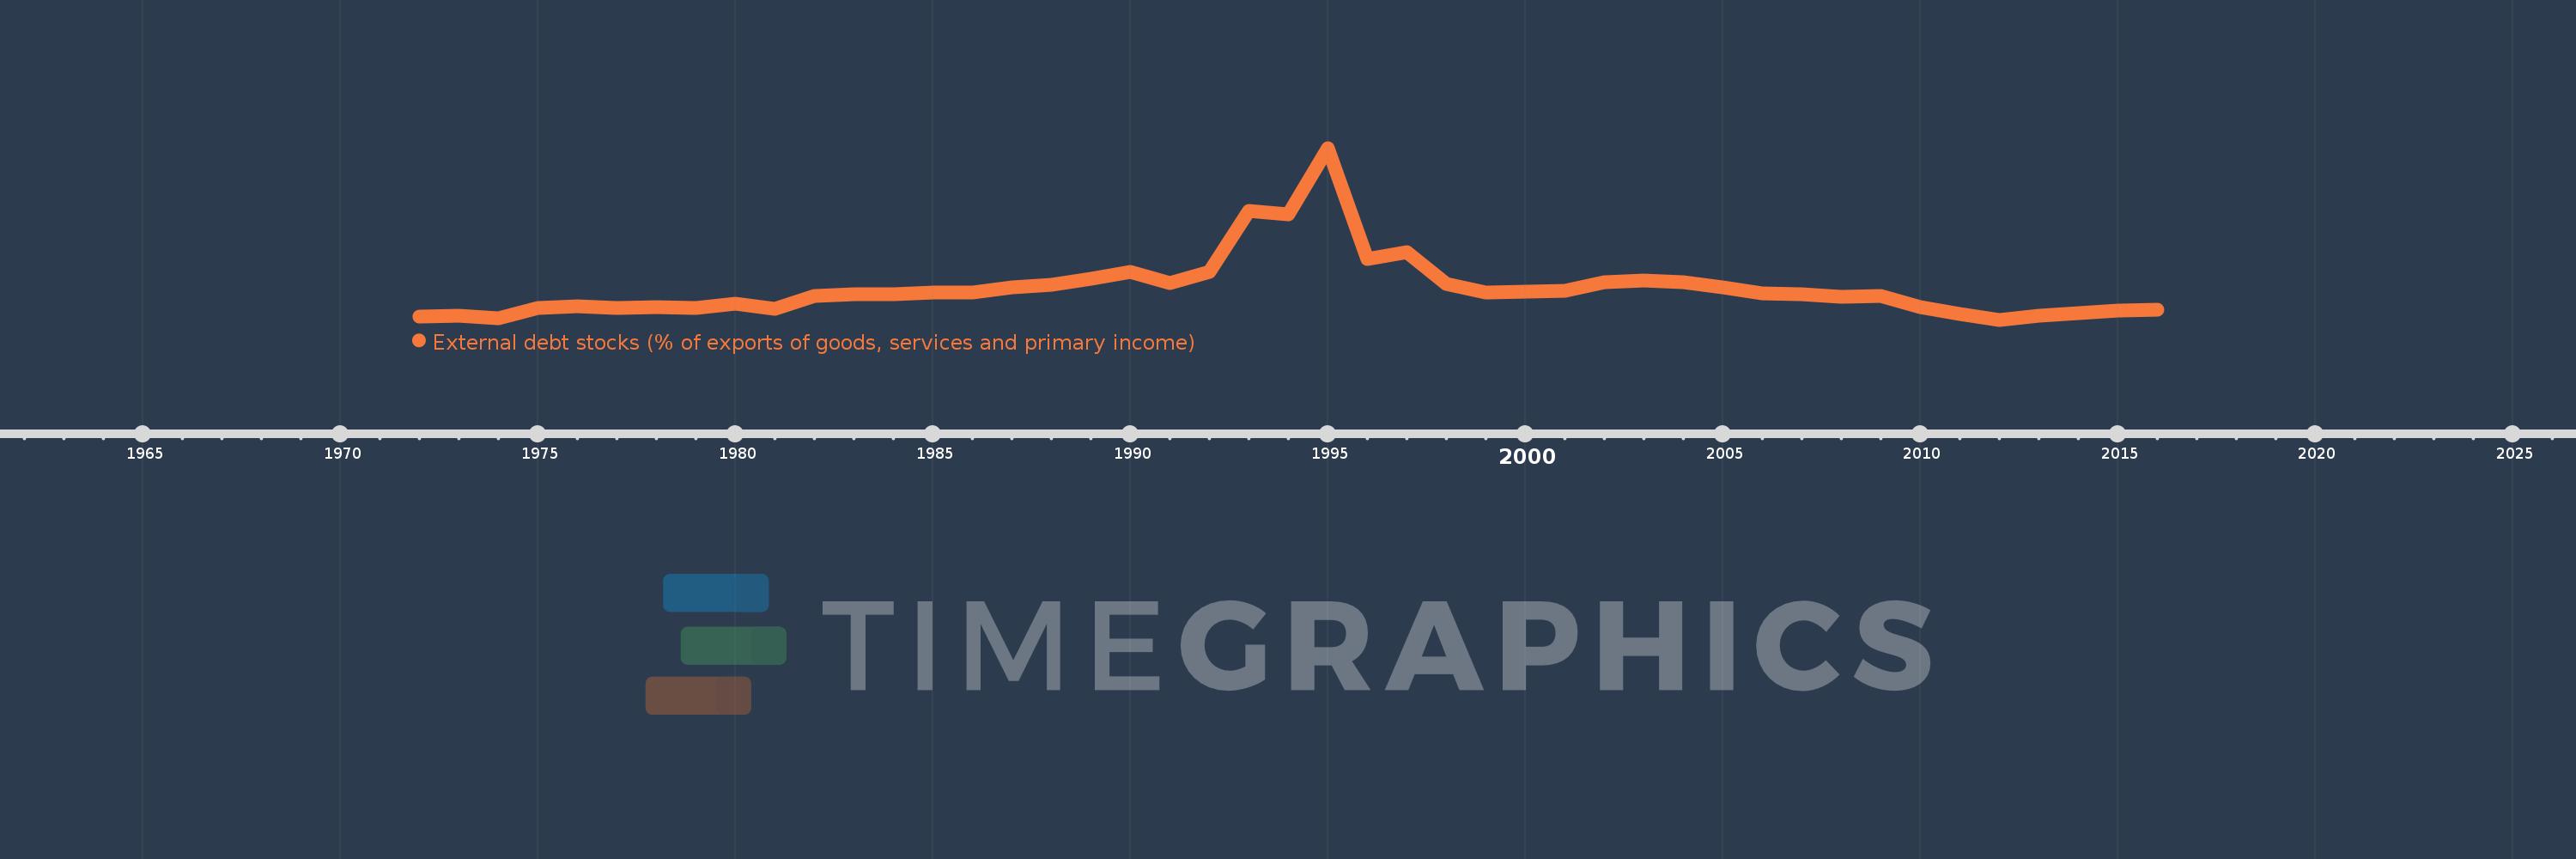
External debt stocks (% of exports of goods, services and primary income)
2016,2015,2014,2013,2012,2011,2010,2009,2008,2007,2006,2005,2004,2003,2002,2001,2000,1999,1998,1997,1996,1995,1994,1993,1992,1991,1990,1989,1988,1987,1986,1985,1984,1983,1982,1981,1980,1979,1978,1977,1976,1975,1974,1973,1972
Estas estadísticas en otros países:
línea de tiempo (timeline):
En esta escala de tiempo se presenta un gráfico de 1972 y 2016 de Haiti. Los datos de 1971 están ausentes. El número de observaciones reales por fecha: 45.
Fuente (nombre):
Indicadores del desarrollo mundial
Fuente (organización):
World Bank, International Debt Statistics.
Categorías:
Economy & Growth, External Debt
Se ha actualizado:
23 abr 2017 año
Los indicadores de los cambios de valor en los últimos años
Mínimo:
56.849
1 ene 2012 año
Máximo:
1.132 mil
1 ene 1995 año
A la fecha de observación
Valor
Cambio absoluto
El cambio con respecto al valor anterior
1 ene 1972 año
78.061
+78.061
0.0%
1 ene 1973 año
84.032
+5.971
7.65%
1 ene 1974 año
67.279
-16.753
-19.94%
1 ene 1975 año
130.806
+63.527
94.42%
1 ene 1976 año
139.735
+8.929
6.83%
1 ene 1977 año
128.056
-11.679
-8.36%
1 ene 1978 año
134.004
+5.948
4.64%
1 ene 1979 año
132.145
-1.859
-1.39%
1 ene 1980 año
155.27
+23.124
17.5%
1 ene 1981 año
123.925
-31.344
-20.19%
1 ene 1982 año
203.57
+79.645
64.27%
1 ene 1983 año
219.001
+15.431
7.58%
1 ene 1984 año
218.808
-0.193
-0.09%
1 ene 1985 año
226.115
+7.307
3.34%
1 ene 1986 año
228.698
+2.583
1.14%
1 ene 1987 año
260.94
+32.242
14.1%
1 ene 1988 año
278.035
+17.095
6.55%
1 ene 1989 año
312.031
+33.996
12.23%
1 ene 1990 año
356.0
+43.97
14.09%
1 ene 1991 año
289.013
-66.988
-18.82%
1 ene 1992 año
355.866
+66.853
23.13%
1 ene 1993 año
735.43
+379.564
106.66%
1 ene 1994 año
716.381
-19.049
-2.59%
1 ene 1995 año
1.132 mil
+415.436
57.99%
1 ene 1996 año
435.331
-696.486
-61.54%
1 ene 1997 año
482.379
+47.048
10.81%
1 ene 1998 año
282.721
-199.658
-41.39%
1 ene 1999 año
225.539
-57.183
-20.23%
1 ene 2000 año
229.97
+4.432
1.97%
1 ene 2001 año
238.911
+8.94
3.89%
1 ene 2002 año
289.394
+50.483
21.13%
1 ene 2003 año
304.132
+14.738
5.09%
1 ene 2004 año
290.506
-13.626
-4.48%
1 ene 2005 año
259.689
-30.817
-10.61%
1 ene 2006 año
222.59
-37.099
-14.29%
1 ene 2007 año
214.787
-7.803
-3.51%
1 ene 2008 año
199.934
-14.853
-6.92%
1 ene 2009 año
207.804
+7.869
3.94%
1 ene 2010 año
135.977
-71.827
-34.56%
1 ene 2011 año
91.203
-44.774
-32.93%
1 ene 2012 año
56.849
-34.354
-37.67%
1 ene 2013 año
82.526
+25.677
45.17%
1 ene 2014 año
96.689
+14.163
17.16%
1 ene 2015 año
115.223
+18.533
19.17%
1 ene 2016 año
117.267
+2.044
1.77%
Ranking de los países por los datos estadísticos actuales


Comentarios: