29
/es/
es
AIzaSyAYiBZKx7MnpbEhh9jyipgxe19OcubqV5w
April 1, 2024
105922
China
CHN
true
2
1
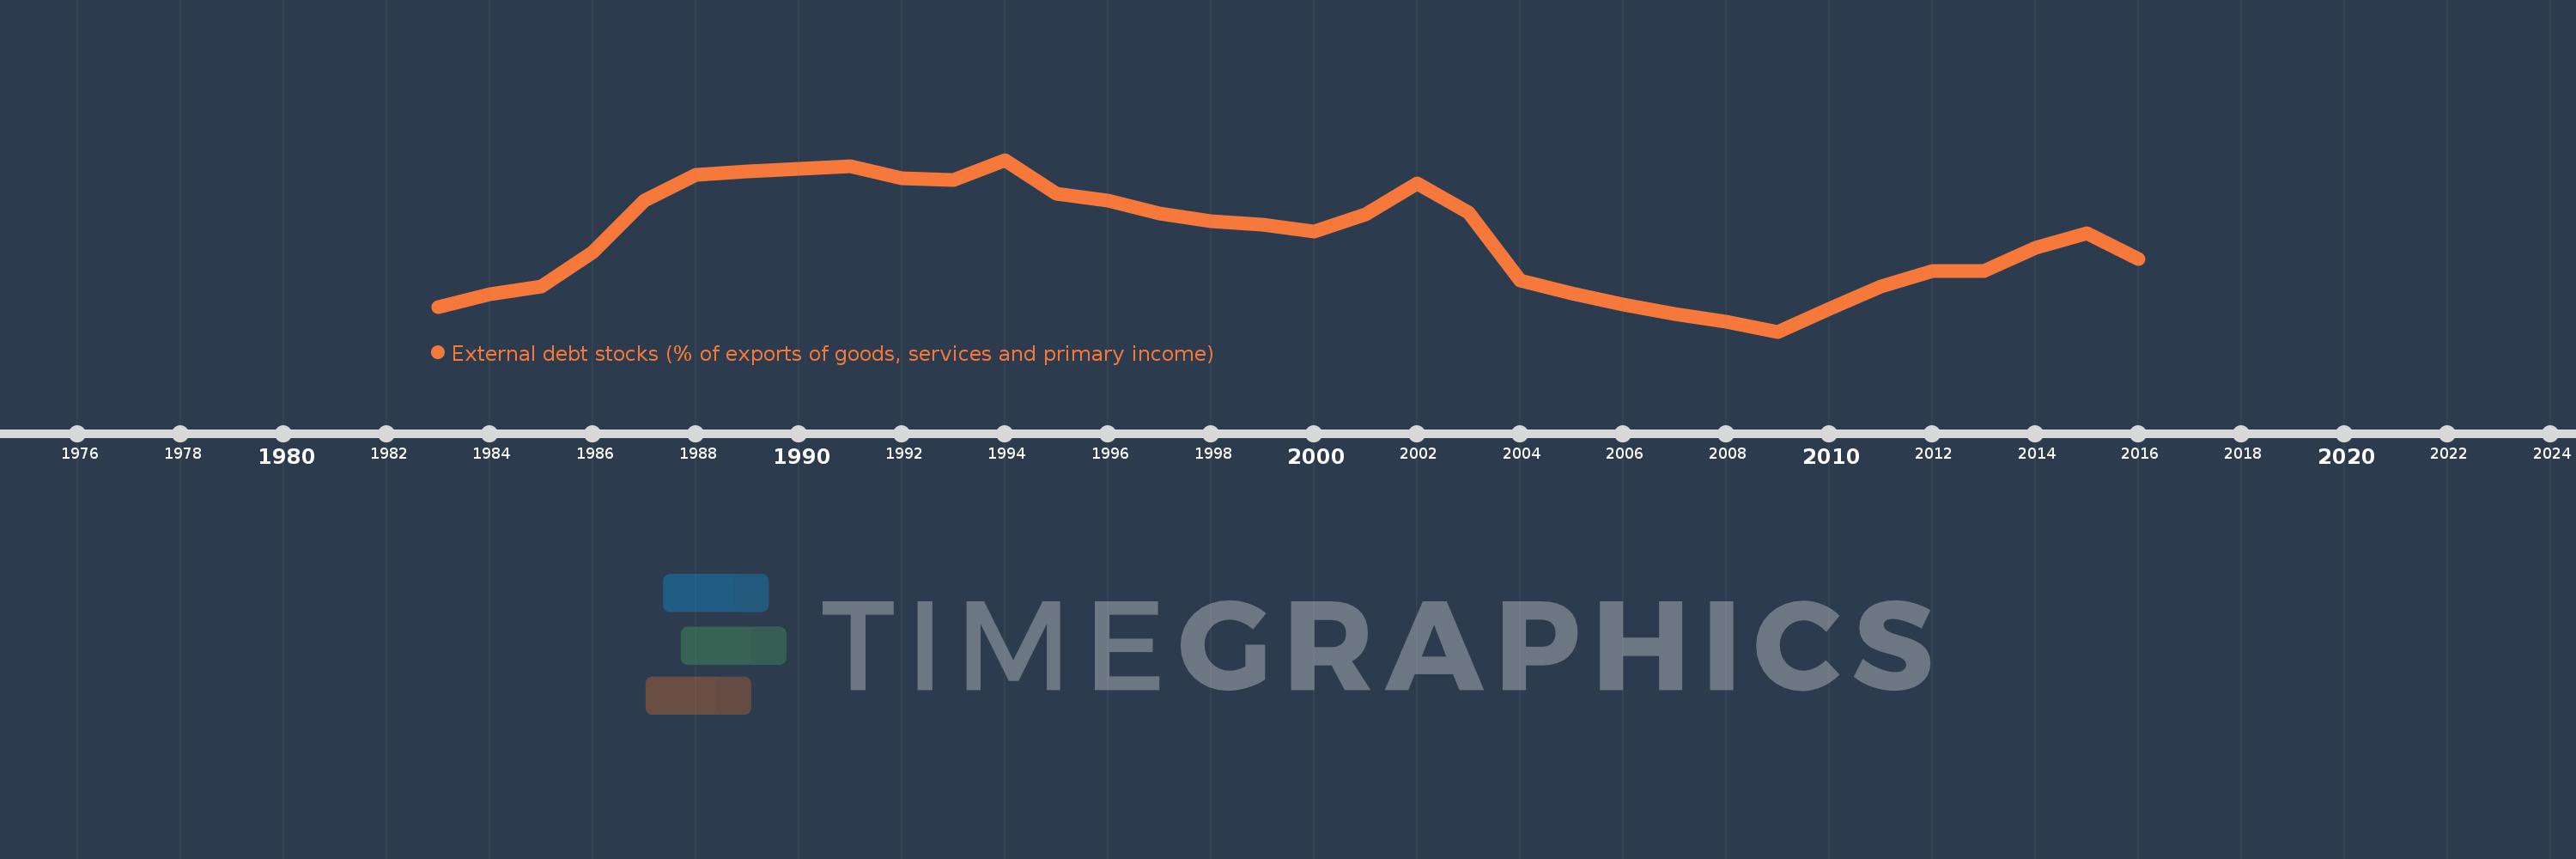
External debt stocks (% of exports of goods, services and primary income)
2016,2015,2014,2013,2012,2011,2010,2009,2008,2007,2006,2005,2004,2003,2002,2001,2000,1999,1998,1997,1996,1995,1994,1993,1992,1991,1990,1989,1988,1987,1986,1985,1984,1983
Estas estadísticas en otros países:
línea de tiempo (timeline):
En esta escala de tiempo se presenta un gráfico de 1983 y 2016 de China. Los datos de 1982 están ausentes. El número de observaciones reales por fecha: 34.
Fuente (nombre):
Indicadores del desarrollo mundial
Fuente (organización):
World Bank, International Debt Statistics.
Categorías:
Economy & Growth, External Debt
Se ha actualizado:
23 abr 2017 año
Los indicadores de los cambios de valor en los últimos años
Mínimo:
23.655
1 ene 2009 año
Máximo:
94.176
1 ene 1994 año
A la fecha de observación
Valor
Cambio absoluto
El cambio con respecto al valor anterior
1 ene 1983 año
33.806
+33.806
0.0%
1 ene 1984 año
38.859
+5.052
14.94%
1 ene 1985 año
42.086
+3.227
8.31%
1 ene 1986 año
56.338
+14.251
33.86%
1 ene 1987 año
77.304
+20.967
37.22%
1 ene 1988 año
88.025
+10.721
13.87%
1 ene 1989 año
89.57
+1.544
1.75%
1 ene 1990 año
90.376
+0.807
0.9%
1 ene 1991 año
91.572
+1.196
1.32%
1 ene 1992 año
86.558
-5.014
-5.48%
1 ene 1993 año
85.803
-0.755
-0.87%
1 ene 1994 año
94.176
+8.373
9.76%
1 ene 1995 año
80.418
-13.757
-14.61%
1 ene 1996 año
77.471
-2.947
-3.67%
1 ene 1997 año
71.966
-5.504
-7.11%
1 ene 1998 año
68.888
-3.078
-4.28%
1 ene 1999 año
67.606
-1.282
-1.86%
1 ene 2000 año
64.801
-2.805
-4.15%
1 ene 2001 año
71.902
+7.101
10.96%
1 ene 2002 año
84.454
+12.551
17.46%
1 ene 2003 año
72.358
-12.096
-14.32%
1 ene 2004 año
44.702
-27.656
-38.22%
1 ene 2005 año
39.301
-5.401
-12.08%
1 ene 2006 año
34.864
-4.437
-11.29%
1 ene 2007 año
30.884
-3.98
-11.42%
1 ene 2008 año
27.859
-3.025
-9.79%
1 ene 2009 año
23.655
-4.204
-15.09%
1 ene 2010 año
32.965
+9.31
39.36%
1 ene 2011 año
42.057
+9.091
27.58%
1 ene 2012 año
48.504
+6.448
15.33%
1 ene 2013 año
48.599
+0.095
0.19%
1 ene 2014 año
57.948
+9.349
19.24%
1 ene 2015 año
64.066
+6.119
10.56%
1 ene 2016 año
53.377
-10.689
-16.68%
Ranking de los países por los datos estadísticos actuales


Comentarios: