29
/es/
es
AIzaSyAYiBZKx7MnpbEhh9jyipgxe19OcubqV5w
April 1, 2024
215702
Oman
OMN
true
2
1
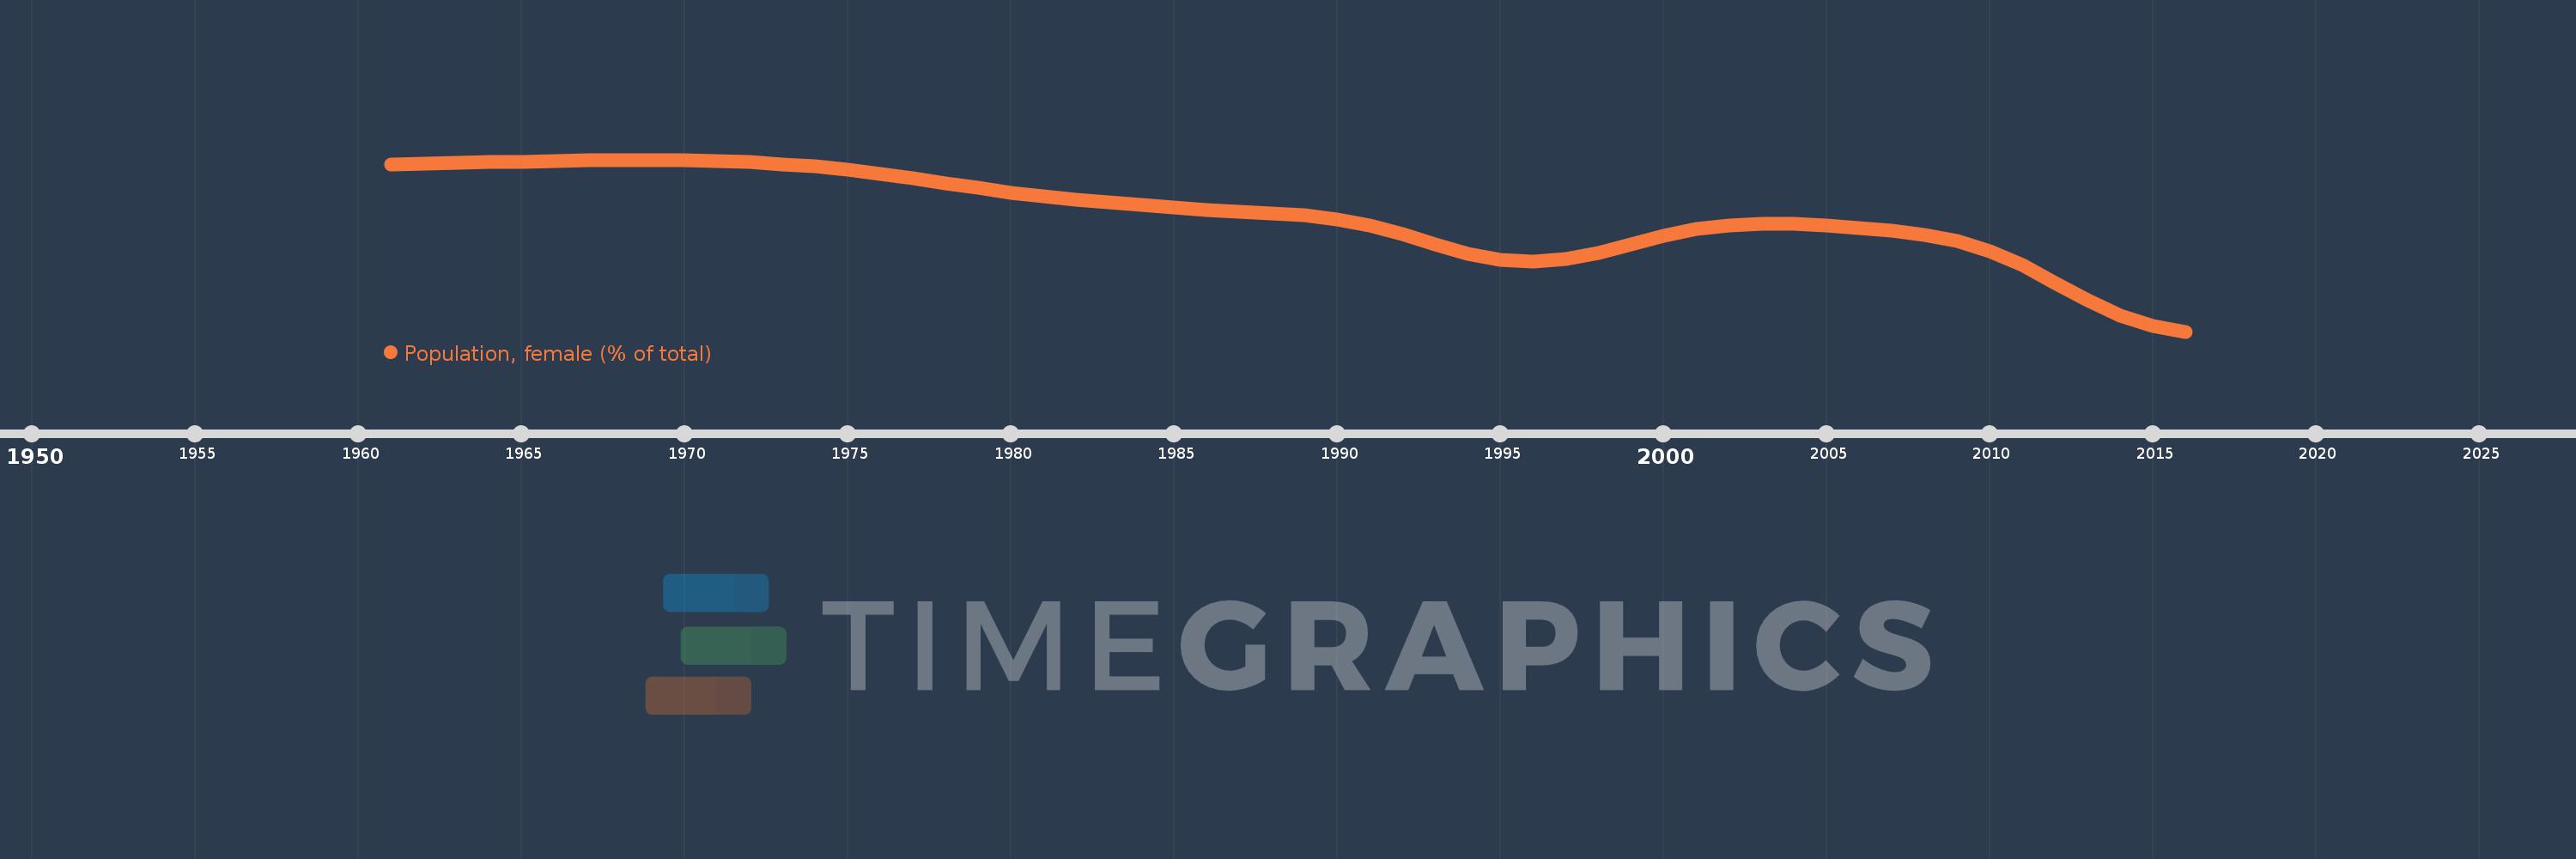
Population, female (% of total)
2016,2015,2014,2013,2012,2011,2010,2009,2008,2007,2006,2005,2004,2003,2002,2001,2000,1999,1998,1997,1996,1995,1994,1993,1992,1991,1990,1989,1988,1987,1986,1985,1984,1983,1982,1981,1980,1979,1978,1977,1976,1975,1974,1973,1972,1971,1970,1969,1968,1967,1966,1965,1964,1963,1962,1961
Estas estadísticas en otros países:
AfghanistanAlbaniaAlgeriaAngolaAntigua and BarbudaArab WorldArgentinaArmeniaArubaAustraliaAustriaAzerbaijanBahamas, TheBahrainBangladeshBarbadosBelarusBelgiumBelizeBeninBhutanBoliviaBosnia and HerzegovinaBotswanaBrazilBrunei DarussalamBulgariaBurkina FasoBurundiCabo VerdeCambodiaCameroonCanadaCaribbean small statesCentral African RepublicCentral Europe and the BalticsChadChannel IslandsChileChinaColombiaComorosCongo, Dem. Rep.Congo, Rep.Costa RicaCote d'IvoireCroatiaCubaCuracaoCyprusCzech RepublicDenmarkDjiboutiDominican RepublicEarly-demographic dividendEast Asia & PacificEast Asia & Pacific (excluding high income)East Asia & Pacific (IDA & IBRD countries)EcuadorEgypt, Arab Rep.El SalvadorEquatorial GuineaEritreaEstoniaEthiopiaEuro areaEurope & Central AsiaEurope & Central Asia (excluding high income)Europe & Central Asia (IDA & IBRD countries)European UnionFijiFinlandFragile and conflict affected situationsFranceFrench PolynesiaGabonGambia, TheGeorgiaGermanyGhanaGreeceGrenadaGuamGuatemalaGuineaGuinea-BissauGuyanaHaitiHeavily indebted poor countries (HIPC)High incomeHondurasHong Kong SAR, ChinaHungaryIBRD onlyIcelandIDA & IBRD totalIDA blendIDA onlyIDA totalIndiaIndonesiaIran, Islamic Rep.IraqIrelandIsraelItalyJamaicaJapanJordanKazakhstanKenyaKiribatiKorea, Dem. People’s Rep.Korea, Rep.KosovoKuwaitKyrgyz RepublicLao PDRLate-demographic dividendLatin America & Caribbean Latin America & Caribbean (excluding high income)Latin America & the Caribbean (IDA & IBRD countries)LatviaLeast developed countries: UN classificationLebanonLesothoLiberiaLibyaLithuaniaLow & middle incomeLow incomeLower middle incomeLuxembourgMacao SAR, ChinaMacedonia, FYRMadagascarMalawiMalaysiaMaldivesMaliMaltaMauritaniaMauritiusMexicoMicronesia, Fed. Sts.Middle East & North AfricaMiddle East & North Africa (excluding high income)Middle East & North Africa (IDA & IBRD countries)Middle incomeMoldovaMongoliaMontenegroMoroccoMozambiqueMyanmarNamibiaNepalNetherlandsNew CaledoniaNew ZealandNicaraguaNigerNigeriaNorth AmericaNorwayOECD membersOmanOther small statesPacific island small statesPakistanPanamaPapua New GuineaParaguayPeruPhilippinesPolandPortugalPost-demographic dividendPre-demographic dividendPuerto RicoQatarRomaniaRussian FederationRwandaSamoaSao Tome and PrincipeSaudi ArabiaSenegalSerbiaSeychellesSierra LeoneSingaporeSlovak RepublicSloveniaSmall statesSolomon IslandsSomaliaSouth AfricaSouth AsiaSouth Asia (IDA & IBRD)South SudanSpainSri LankaSt. LuciaSt. Vincent and the GrenadinesSub-Saharan Africa Sub-Saharan Africa (excluding high income)Sub-Saharan Africa (IDA & IBRD countries)SudanSurinameSwazilandSwedenSwitzerlandSyrian Arab RepublicTajikistanTanzaniaThailandTimor-LesteTogoTongaTrinidad and TobagoTunisiaTurkeyTurkmenistanUgandaUkraineUnited Arab EmiratesUnited KingdomUnited StatesUpper middle incomeUruguayUzbekistanVanuatuVenezuela, RBVietnamVirgin Islands (U.S.)West Bank and GazaWorldYemen, Rep.ZambiaZimbabwe línea de tiempo (timeline):
En esta escala de tiempo se presenta un gráfico de 1961 y 2016 de Oman. Los datos de 1960 están ausentes. El número de observaciones reales por fecha: 56.
Fuente (nombre):
Indicadores del desarrollo mundial
Fuente (organización):
World Bank staff estimates based on male/female distributions of United Nations Population Division's World Population Prospects.
Categorías:
Health
Se ha actualizado:
23 abr 2017 año
Los indicadores de los cambios de valor en los últimos años
Mínimo:
33.669
1 ene 2016 año
Máximo:
50.984
1 ene 1969 año
A la fecha de observación
Valor
Cambio absoluto
El cambio con respecto al valor anterior
1 ene 1961 año
50.469
+50.469
0.0%
1 ene 1962 año
50.564
+0.094
0.19%
1 ene 1963 año
50.648
+0.085
0.17%
1 ene 1964 año
50.725
+0.077
0.15%
1 ene 1965 año
50.798
+0.072
0.14%
1 ene 1966 año
50.865
+0.068
0.13%
1 ene 1967 año
50.925
+0.06
0.12%
1 ene 1968 año
50.969
+0.044
0.09%
1 ene 1969 año
50.984
+0.014
0.03%
1 ene 1970 año
50.953
-0.031
-0.06%
1 ene 1971 año
50.866
-0.087
-0.17%
1 ene 1972 año
50.729
-0.137
-0.27%
1 ene 1973 año
50.545
-0.185
-0.36%
1 ene 1974 año
50.3
-0.245
-0.48%
1 ene 1975 año
49.982
-0.318
-0.63%
1 ene 1976 año
49.593
-0.389
-0.78%
1 ene 1977 año
49.137
-0.456
-0.92%
1 ene 1978 año
48.639
-0.498
-1.01%
1 ene 1979 año
48.141
-0.498
-1.02%
1 ene 1980 año
47.686
-0.455
-0.94%
1 ene 1981 año
47.298
-0.389
-0.82%
1 ene 1982 año
46.967
-0.33
-0.7%
1 ene 1983 año
46.678
-0.289
-0.62%
1 ene 1984 año
46.42
-0.258
-0.55%
1 ene 1985 año
46.182
-0.238
-0.51%
1 ene 1986 año
45.949
-0.233
-0.5%
1 ene 1987 año
45.756
-0.193
-0.42%
1 ene 1988 año
45.591
-0.165
-0.36%
1 ene 1989 año
45.36
-0.231
-0.51%
1 ene 1990 año
44.956
-0.404
-0.89%
1 ene 1991 año
44.338
-0.618
-1.38%
1 ene 1992 año
43.475
-0.863
-1.95%
1 ene 1993 año
42.467
-1.007
-2.32%
1 ene 1994 año
41.533
-0.934
-2.2%
1 ene 1995 año
40.907
-0.626
-1.51%
1 ene 1996 año
40.711
-0.197
-0.48%
1 ene 1997 año
40.97
+0.259
0.64%
1 ene 1998 año
41.598
+0.628
1.53%
1 ene 1999 año
42.452
+0.853
2.05%
1 ene 2000 año
43.307
+0.856
2.02%
1 ene 2001 año
43.98
+0.673
1.55%
1 ene 2002 año
44.394
+0.414
0.94%
1 ene 2003 año
44.573
+0.179
0.4%
1 ene 2004 año
44.548
-0.025
-0.06%
1 ene 2005 año
44.386
-0.163
-0.37%
1 ene 2006 año
44.12
-0.266
-0.6%
1 ene 2007 año
43.815
-0.305
-0.69%
1 ene 2008 año
43.433
-0.382
-0.87%
1 ene 2009 año
42.812
-0.621
-1.43%
1 ene 2010 año
41.779
-1.033
-2.41%
1 ene 2011 año
40.342
-1.437
-3.44%
1 ene 2012 año
38.597
-1.745
-4.33%
1 ene 2013 año
36.814
-1.783
-4.62%
1 ene 2014 año
35.296
-1.518
-4.12%
1 ene 2015 año
34.239
-1.057
-3.0%
1 ene 2016 año
33.669
-0.57
-1.66%
Ranking de los países por los datos estadísticos actuales


Comentarios: