29
/es/
es
AIzaSyAYiBZKx7MnpbEhh9jyipgxe19OcubqV5w
April 1, 2024
149578
Haiti
HTI
true
2
1
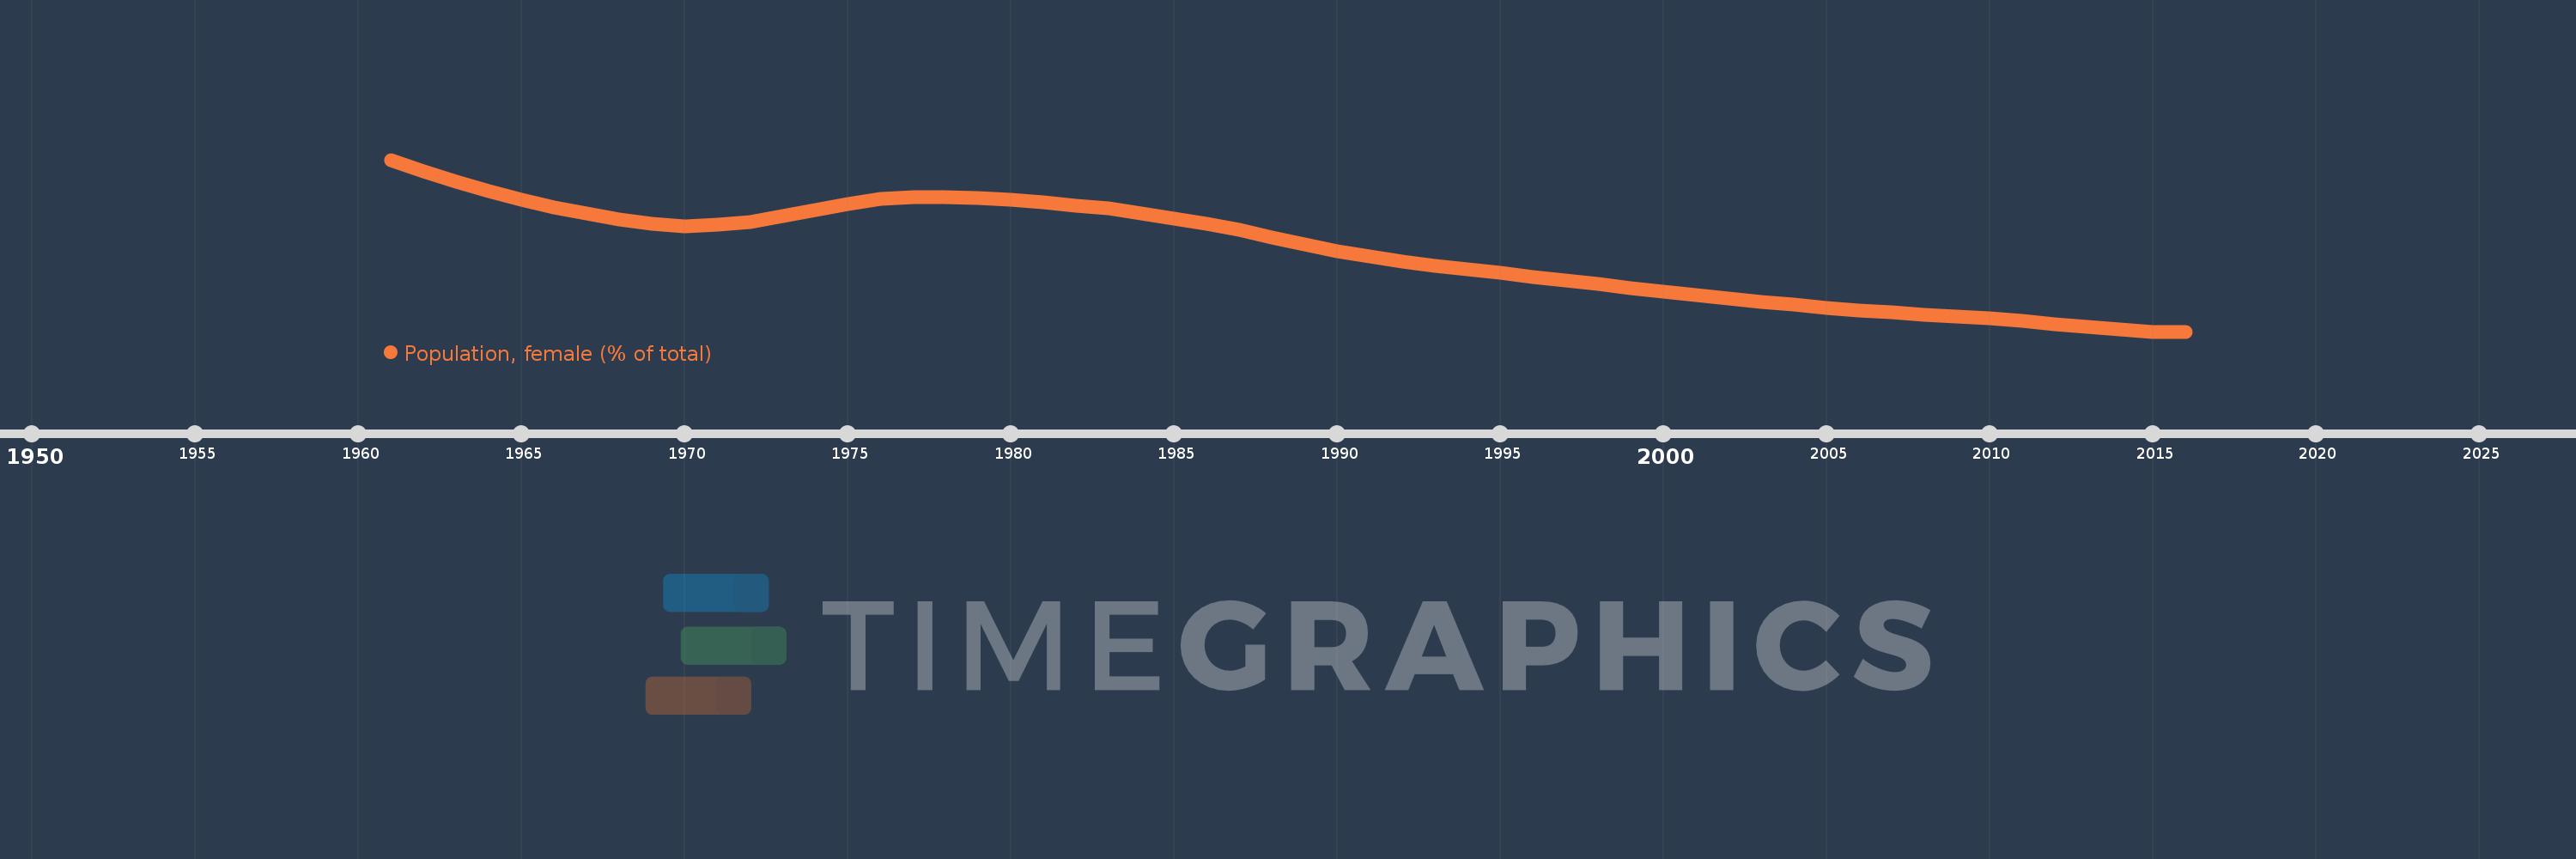
Population, female (% of total)
2016,2015,2014,2013,2012,2011,2010,2009,2008,2007,2006,2005,2004,2003,2002,2001,2000,1999,1998,1997,1996,1995,1994,1993,1992,1991,1990,1989,1988,1987,1986,1985,1984,1983,1982,1981,1980,1979,1978,1977,1976,1975,1974,1973,1972,1971,1970,1969,1968,1967,1966,1965,1964,1963,1962,1961
Estas estadísticas en otros países:
AfghanistanAlbaniaAlgeriaAngolaAntigua and BarbudaArab WorldArgentinaArmeniaArubaAustraliaAustriaAzerbaijanBahamas, TheBahrainBangladeshBarbadosBelarusBelgiumBelizeBeninBhutanBoliviaBosnia and HerzegovinaBotswanaBrazilBrunei DarussalamBulgariaBurkina FasoBurundiCabo VerdeCambodiaCameroonCanadaCaribbean small statesCentral African RepublicCentral Europe and the BalticsChadChannel IslandsChileChinaColombiaComorosCongo, Dem. Rep.Congo, Rep.Costa RicaCote d'IvoireCroatiaCubaCuracaoCyprusCzech RepublicDenmarkDjiboutiDominican RepublicEarly-demographic dividendEast Asia & PacificEast Asia & Pacific (excluding high income)East Asia & Pacific (IDA & IBRD countries)EcuadorEgypt, Arab Rep.El SalvadorEquatorial GuineaEritreaEstoniaEthiopiaEuro areaEurope & Central AsiaEurope & Central Asia (excluding high income)Europe & Central Asia (IDA & IBRD countries)European UnionFijiFinlandFragile and conflict affected situationsFranceFrench PolynesiaGabonGambia, TheGeorgiaGermanyGhanaGreeceGrenadaGuamGuatemalaGuineaGuinea-BissauGuyanaHaitiHeavily indebted poor countries (HIPC)High incomeHondurasHong Kong SAR, ChinaHungaryIBRD onlyIcelandIDA & IBRD totalIDA blendIDA onlyIDA totalIndiaIndonesiaIran, Islamic Rep.IraqIrelandIsraelItalyJamaicaJapanJordanKazakhstanKenyaKiribatiKorea, Dem. People’s Rep.Korea, Rep.KosovoKuwaitKyrgyz RepublicLao PDRLate-demographic dividendLatin America & Caribbean Latin America & Caribbean (excluding high income)Latin America & the Caribbean (IDA & IBRD countries)LatviaLeast developed countries: UN classificationLebanonLesothoLiberiaLibyaLithuaniaLow & middle incomeLow incomeLower middle incomeLuxembourgMacao SAR, ChinaMacedonia, FYRMadagascarMalawiMalaysiaMaldivesMaliMaltaMauritaniaMauritiusMexicoMicronesia, Fed. Sts.Middle East & North AfricaMiddle East & North Africa (excluding high income)Middle East & North Africa (IDA & IBRD countries)Middle incomeMoldovaMongoliaMontenegroMoroccoMozambiqueMyanmarNamibiaNepalNetherlandsNew CaledoniaNew ZealandNicaraguaNigerNigeriaNorth AmericaNorwayOECD membersOmanOther small statesPacific island small statesPakistanPanamaPapua New GuineaParaguayPeruPhilippinesPolandPortugalPost-demographic dividendPre-demographic dividendPuerto RicoQatarRomaniaRussian FederationRwandaSamoaSao Tome and PrincipeSaudi ArabiaSenegalSerbiaSeychellesSierra LeoneSingaporeSlovak RepublicSloveniaSmall statesSolomon IslandsSomaliaSouth AfricaSouth AsiaSouth Asia (IDA & IBRD)South SudanSpainSri LankaSt. LuciaSt. Vincent and the GrenadinesSub-Saharan Africa Sub-Saharan Africa (excluding high income)Sub-Saharan Africa (IDA & IBRD countries)SudanSurinameSwazilandSwedenSwitzerlandSyrian Arab RepublicTajikistanTanzaniaThailandTimor-LesteTogoTongaTrinidad and TobagoTunisiaTurkeyTurkmenistanUgandaUkraineUnited Arab EmiratesUnited KingdomUnited StatesUpper middle incomeUruguayUzbekistanVanuatuVenezuela, RBVietnamVirgin Islands (U.S.)West Bank and GazaWorldYemen, Rep.ZambiaZimbabwe línea de tiempo (timeline):
En esta escala de tiempo se presenta un gráfico de 1961 y 2016 de Haiti. Los datos de 1960 están ausentes. El número de observaciones reales por fecha: 56.
Fuente (nombre):
Indicadores del desarrollo mundial
Fuente (organización):
World Bank staff estimates based on male/female distributions of United Nations Population Division's World Population Prospects.
Categorías:
Health
Se ha actualizado:
23 abr 2017 año
Los indicadores de los cambios de valor en los últimos años
Mínimo:
50.543
1 ene 2016 año
Máximo:
50.922
1 ene 1961 año
A la fecha de observación
Valor
Cambio absoluto
El cambio con respecto al valor anterior
1 ene 1961 año
50.922
+50.922
0.0%
1 ene 1962 año
50.897
-0.025
-0.05%
1 ene 1963 año
50.874
-0.023
-0.05%
1 ene 1964 año
50.853
-0.021
-0.04%
1 ene 1965 año
50.834
-0.019
-0.04%
1 ene 1966 año
50.817
-0.017
-0.03%
1 ene 1967 año
50.803
-0.015
-0.03%
1 ene 1968 año
50.79
-0.013
-0.03%
1 ene 1969 año
50.78
-0.009
-0.02%
1 ene 1970 año
50.776
-0.004
-0.01%
1 ene 1971 año
50.778
+0.001
0.0%
1 ene 1972 año
50.785
+0.008
0.01%
1 ene 1973 año
50.798
+0.012
0.02%
1 ene 1974 año
50.812
+0.015
0.03%
1 ene 1975 año
50.825
+0.013
0.03%
1 ene 1976 año
50.835
+0.009
0.02%
1 ene 1977 año
50.84
+0.005
0.01%
1 ene 1978 año
50.84
+0.001
0.0%
1 ene 1979 año
50.838
-0.002
0.0%
1 ene 1980 año
50.834
-0.004
-0.01%
1 ene 1981 año
50.828
-0.006
-0.01%
1 ene 1982 año
50.821
-0.007
-0.01%
1 ene 1983 año
50.814
-0.008
-0.02%
1 ene 1984 año
50.804
-0.009
-0.02%
1 ene 1985 año
50.793
-0.011
-0.02%
1 ene 1986 año
50.781
-0.013
-0.02%
1 ene 1987 año
50.767
-0.014
-0.03%
1 ene 1988 año
50.751
-0.015
-0.03%
1 ene 1989 año
50.736
-0.016
-0.03%
1 ene 1990 año
50.721
-0.015
-0.03%
1 ene 1991 año
50.708
-0.013
-0.03%
1 ene 1992 año
50.697
-0.011
-0.02%
1 ene 1993 año
50.688
-0.009
-0.02%
1 ene 1994 año
50.68
-0.008
-0.02%
1 ene 1995 año
50.672
-0.008
-0.02%
1 ene 1996 año
50.664
-0.008
-0.02%
1 ene 1997 año
50.656
-0.008
-0.02%
1 ene 1998 año
50.648
-0.008
-0.02%
1 ene 1999 año
50.639
-0.008
-0.02%
1 ene 2000 año
50.631
-0.008
-0.02%
1 ene 2001 año
50.624
-0.008
-0.02%
1 ene 2002 año
50.616
-0.007
-0.01%
1 ene 2003 año
50.609
-0.007
-0.01%
1 ene 2004 año
50.602
-0.007
-0.01%
1 ene 2005 año
50.596
-0.006
-0.01%
1 ene 2006 año
50.59
-0.006
-0.01%
1 ene 2007 año
50.585
-0.005
-0.01%
1 ene 2008 año
50.58
-0.004
-0.01%
1 ene 2009 año
50.576
-0.004
-0.01%
1 ene 2010 año
50.572
-0.005
-0.01%
1 ene 2011 año
50.566
-0.005
-0.01%
1 ene 2012 año
50.56
-0.006
-0.01%
1 ene 2013 año
50.553
-0.007
-0.01%
1 ene 2014 año
50.547
-0.006
-0.01%
1 ene 2015 año
50.543
-0.004
-0.01%
1 ene 2016 año
50.543
-0.001
0.0%
Ranking de los países por los datos estadísticos actuales


Comentarios: