29
/es/
es
AIzaSyAYiBZKx7MnpbEhh9jyipgxe19OcubqV5w
April 1, 2024
155123
India
IND
true
2
1
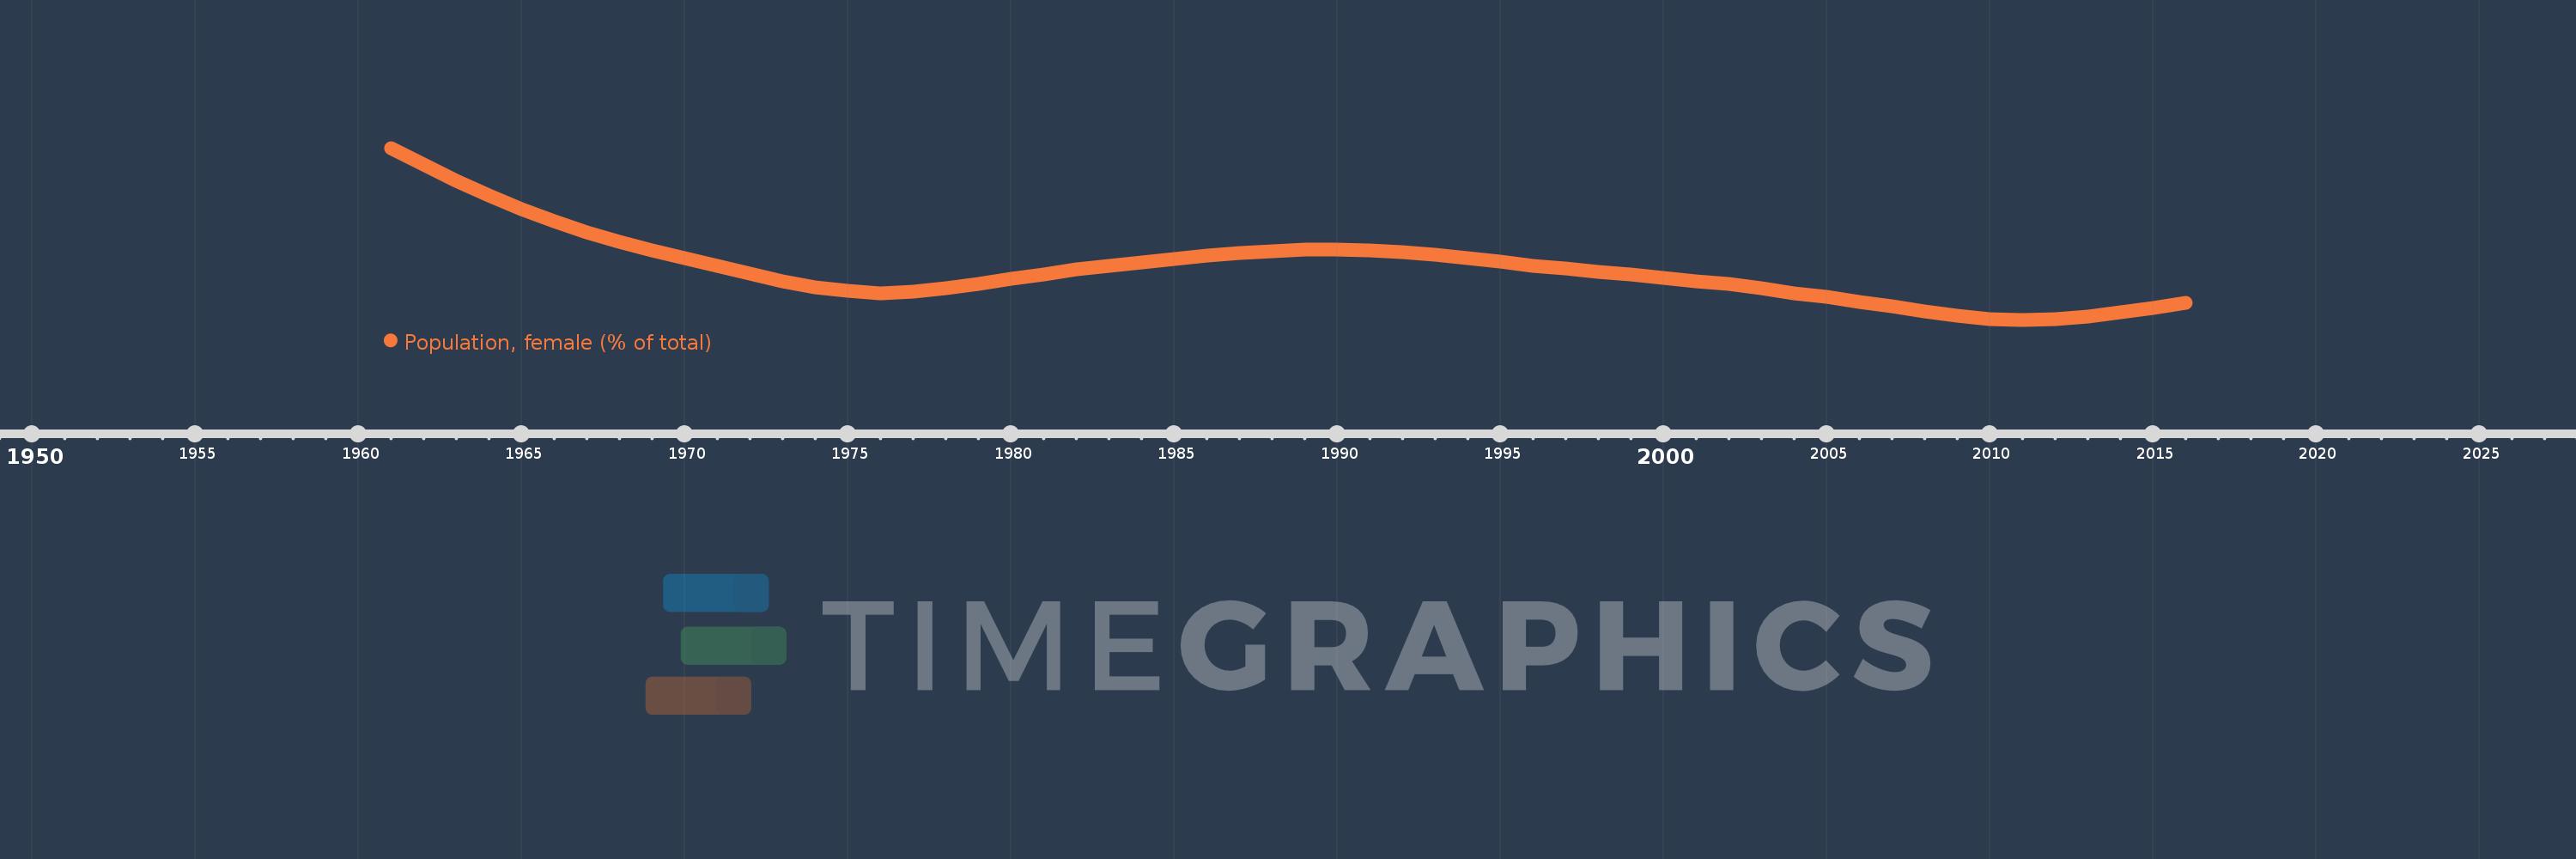
Population, female (% of total)
2016,2015,2014,2013,2012,2011,2010,2009,2008,2007,2006,2005,2004,2003,2002,2001,2000,1999,1998,1997,1996,1995,1994,1993,1992,1991,1990,1989,1988,1987,1986,1985,1984,1983,1982,1981,1980,1979,1978,1977,1976,1975,1974,1973,1972,1971,1970,1969,1968,1967,1966,1965,1964,1963,1962,1961
Estas estadísticas en otros países:
AfghanistanAlbaniaAlgeriaAngolaAntigua and BarbudaArab WorldArgentinaArmeniaArubaAustraliaAustriaAzerbaijanBahamas, TheBahrainBangladeshBarbadosBelarusBelgiumBelizeBeninBhutanBoliviaBosnia and HerzegovinaBotswanaBrazilBrunei DarussalamBulgariaBurkina FasoBurundiCabo VerdeCambodiaCameroonCanadaCaribbean small statesCentral African RepublicCentral Europe and the BalticsChadChannel IslandsChileChinaColombiaComorosCongo, Dem. Rep.Congo, Rep.Costa RicaCote d'IvoireCroatiaCubaCuracaoCyprusCzech RepublicDenmarkDjiboutiDominican RepublicEarly-demographic dividendEast Asia & PacificEast Asia & Pacific (excluding high income)East Asia & Pacific (IDA & IBRD countries)EcuadorEgypt, Arab Rep.El SalvadorEquatorial GuineaEritreaEstoniaEthiopiaEuro areaEurope & Central AsiaEurope & Central Asia (excluding high income)Europe & Central Asia (IDA & IBRD countries)European UnionFijiFinlandFragile and conflict affected situationsFranceFrench PolynesiaGabonGambia, TheGeorgiaGermanyGhanaGreeceGrenadaGuamGuatemalaGuineaGuinea-BissauGuyanaHaitiHeavily indebted poor countries (HIPC)High incomeHondurasHong Kong SAR, ChinaHungaryIBRD onlyIcelandIDA & IBRD totalIDA blendIDA onlyIDA totalIndiaIndonesiaIran, Islamic Rep.IraqIrelandIsraelItalyJamaicaJapanJordanKazakhstanKenyaKiribatiKorea, Dem. People’s Rep.Korea, Rep.KosovoKuwaitKyrgyz RepublicLao PDRLate-demographic dividendLatin America & Caribbean Latin America & Caribbean (excluding high income)Latin America & the Caribbean (IDA & IBRD countries)LatviaLeast developed countries: UN classificationLebanonLesothoLiberiaLibyaLithuaniaLow & middle incomeLow incomeLower middle incomeLuxembourgMacao SAR, ChinaMacedonia, FYRMadagascarMalawiMalaysiaMaldivesMaliMaltaMauritaniaMauritiusMexicoMicronesia, Fed. Sts.Middle East & North AfricaMiddle East & North Africa (excluding high income)Middle East & North Africa (IDA & IBRD countries)Middle incomeMoldovaMongoliaMontenegroMoroccoMozambiqueMyanmarNamibiaNepalNetherlandsNew CaledoniaNew ZealandNicaraguaNigerNigeriaNorth AmericaNorwayOECD membersOmanOther small statesPacific island small statesPakistanPanamaPapua New GuineaParaguayPeruPhilippinesPolandPortugalPost-demographic dividendPre-demographic dividendPuerto RicoQatarRomaniaRussian FederationRwandaSamoaSao Tome and PrincipeSaudi ArabiaSenegalSerbiaSeychellesSierra LeoneSingaporeSlovak RepublicSloveniaSmall statesSolomon IslandsSomaliaSouth AfricaSouth AsiaSouth Asia (IDA & IBRD)South SudanSpainSri LankaSt. LuciaSt. Vincent and the GrenadinesSub-Saharan Africa Sub-Saharan Africa (excluding high income)Sub-Saharan Africa (IDA & IBRD countries)SudanSurinameSwazilandSwedenSwitzerlandSyrian Arab RepublicTajikistanTanzaniaThailandTimor-LesteTogoTongaTrinidad and TobagoTunisiaTurkeyTurkmenistanUgandaUkraineUnited Arab EmiratesUnited KingdomUnited StatesUpper middle incomeUruguayUzbekistanVanuatuVenezuela, RBVietnamVirgin Islands (U.S.)West Bank and GazaWorldYemen, Rep.ZambiaZimbabwe línea de tiempo (timeline):
En esta escala de tiempo se presenta un gráfico de 1961 y 2016 de India. Los datos de 1960 están ausentes. El número de observaciones reales por fecha: 56.
Fuente (nombre):
Indicadores del desarrollo mundial
Fuente (organización):
World Bank staff estimates based on male/female distributions of United Nations Population Division's World Population Prospects.
Categorías:
Health
Se ha actualizado:
23 abr 2017 año
Los indicadores de los cambios de valor en los últimos años
Mínimo:
48.143
1 ene 2011 año
Máximo:
48.4
1 ene 1961 año
A la fecha de observación
Valor
Cambio absoluto
El cambio con respecto al valor anterior
1 ene 1961 año
48.4
+48.4
0.0%
1 ene 1962 año
48.375
-0.025
-0.05%
1 ene 1963 año
48.351
-0.024
-0.05%
1 ene 1964 año
48.329
-0.022
-0.05%
1 ene 1965 año
48.309
-0.02
-0.04%
1 ene 1966 año
48.29
-0.018
-0.04%
1 ene 1967 año
48.274
-0.016
-0.03%
1 ene 1968 año
48.259
-0.014
-0.03%
1 ene 1969 año
48.247
-0.013
-0.03%
1 ene 1970 año
48.235
-0.012
-0.02%
1 ene 1971 año
48.223
-0.012
-0.02%
1 ene 1972 año
48.212
-0.011
-0.02%
1 ene 1973 año
48.201
-0.011
-0.02%
1 ene 1974 año
48.192
-0.009
-0.02%
1 ene 1975 año
48.186
-0.006
-0.01%
1 ene 1976 año
48.183
-0.002
0.0%
1 ene 1977 año
48.185
+0.002
0.0%
1 ene 1978 año
48.19
+0.005
0.01%
1 ene 1979 año
48.196
+0.007
0.01%
1 ene 1980 año
48.204
+0.008
0.02%
1 ene 1981 año
48.211
+0.007
0.02%
1 ene 1982 año
48.218
+0.007
0.01%
1 ene 1983 año
48.224
+0.006
0.01%
1 ene 1984 año
48.229
+0.006
0.01%
1 ene 1985 año
48.234
+0.005
0.01%
1 ene 1986 año
48.239
+0.004
0.01%
1 ene 1987 año
48.243
+0.004
0.01%
1 ene 1988 año
48.246
+0.003
0.01%
1 ene 1989 año
48.248
+0.002
0.0%
1 ene 1990 año
48.248
+0.001
0.0%
1 ene 1991 año
48.247
-0.001
0.0%
1 ene 1992 año
48.244
-0.003
-0.01%
1 ene 1993 año
48.24
-0.004
-0.01%
1 ene 1994 año
48.235
-0.005
-0.01%
1 ene 1995 año
48.23
-0.005
-0.01%
1 ene 1996 año
48.224
-0.005
-0.01%
1 ene 1997 año
48.22
-0.005
-0.01%
1 ene 1998 año
48.215
-0.004
-0.01%
1 ene 1999 año
48.211
-0.004
-0.01%
1 ene 2000 año
48.206
-0.005
-0.01%
1 ene 2001 año
48.201
-0.005
-0.01%
1 ene 2002 año
48.196
-0.006
-0.01%
1 ene 2003 año
48.19
-0.006
-0.01%
1 ene 2004 año
48.183
-0.006
-0.01%
1 ene 2005 año
48.177
-0.007
-0.01%
1 ene 2006 año
48.17
-0.007
-0.01%
1 ene 2007 año
48.163
-0.007
-0.02%
1 ene 2008 año
48.155
-0.007
-0.02%
1 ene 2009 año
48.149
-0.007
-0.01%
1 ene 2010 año
48.144
-0.004
-0.01%
1 ene 2011 año
48.143
-0.002
0.0%
1 ene 2012 año
48.144
+0.001
0.0%
1 ene 2013 año
48.148
+0.004
0.01%
1 ene 2014 año
48.154
+0.006
0.01%
1 ene 2015 año
48.161
+0.007
0.01%
1 ene 2016 año
48.168
+0.007
0.01%
Ranking de los países por los datos estadísticos actuales


Comentarios: