29
/es/
es
AIzaSyAYiBZKx7MnpbEhh9jyipgxe19OcubqV5w
April 1, 2024
198867
Mongolia
MNG
true
2
1
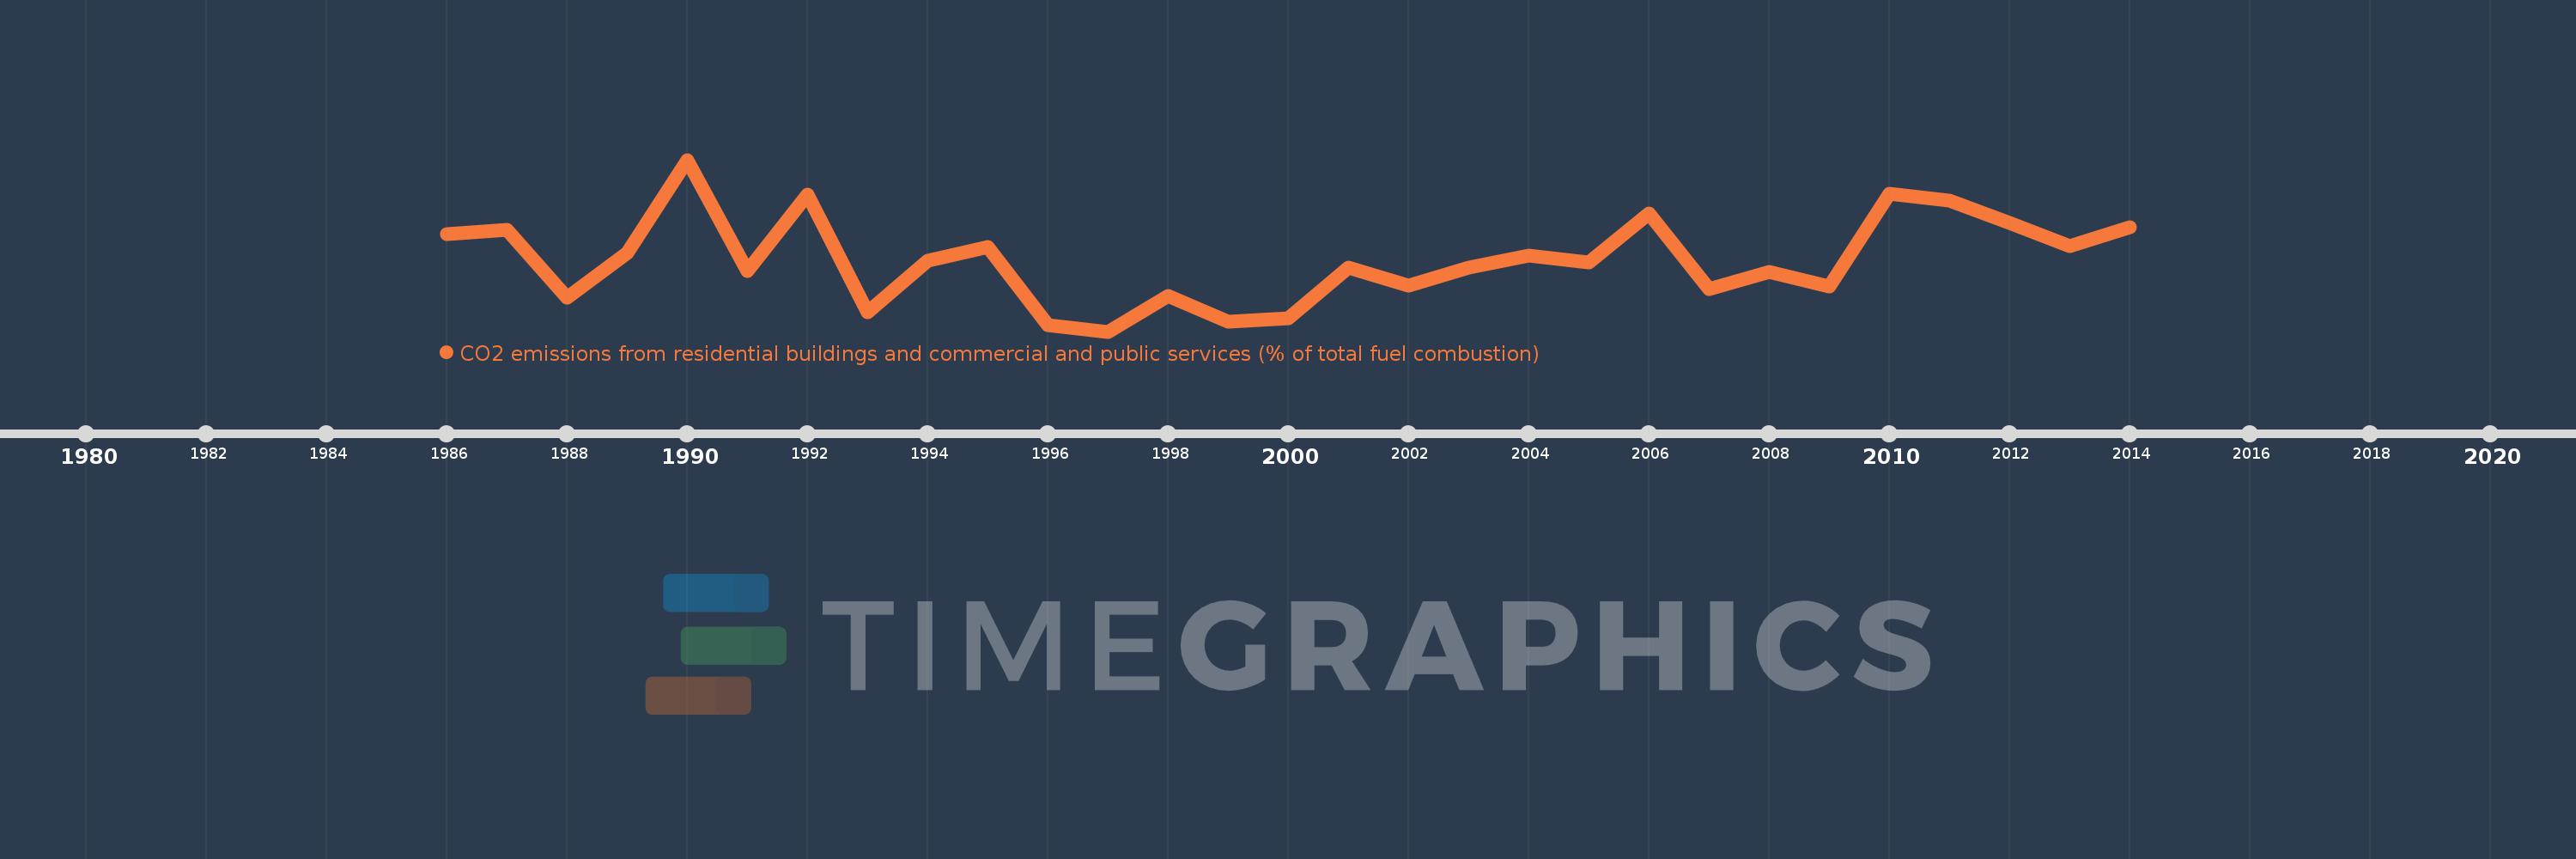
CO2 emissions from residential buildings and commercial and public services (% of total fuel combustion)
2014,2013,2012,2011,2010,2009,2008,2007,2006,2005,2004,2003,2002,2001,2000,1999,1998,1997,1996,1995,1994,1993,1992,1991,1990,1989,1988,1987,1986
Estas estadísticas en otros países:
AlbaniaAlgeriaAngolaArab WorldArgentinaArmeniaAustraliaAustriaAzerbaijanBahrainBangladeshBelarusBelgiumBeninBoliviaBosnia and HerzegovinaBotswanaBrazilBrunei DarussalamBulgariaCambodiaCameroonCanadaCaribbean small statesCentral Europe and the BalticsChileChinaColombiaCongo, Dem. Rep.Congo, Rep.Costa RicaCote d'IvoireCroatiaCubaCuracaoCyprusCzech RepublicDenmarkDominican RepublicEarly-demographic dividendEast Asia & PacificEast Asia & Pacific (excluding high income)East Asia & Pacific (IDA & IBRD countries)EcuadorEgypt, Arab Rep.El SalvadorEritreaEstoniaEthiopiaEuro areaEurope & Central AsiaEurope & Central Asia (excluding high income)Europe & Central Asia (IDA & IBRD countries)European UnionFinlandFragile and conflict affected situationsFranceGabonGeorgiaGermanyGhanaGibraltarGreeceGuatemalaHaitiHeavily indebted poor countries (HIPC)High incomeHondurasHong Kong SAR, ChinaHungaryIBRD onlyIcelandIDA & IBRD totalIDA blendIDA onlyIDA totalIndiaIndonesiaIran, Islamic Rep.IraqIrelandIsraelItalyJamaicaJapanJordanKazakhstanKenyaKorea, Dem. People’s Rep.Korea, Rep.KosovoKuwaitKyrgyz RepublicLate-demographic dividendLatin America & Caribbean Latin America & Caribbean (excluding high income)Latin America & the Caribbean (IDA & IBRD countries)LatviaLeast developed countries: UN classificationLebanonLibyaLithuaniaLow & middle incomeLow incomeLower middle incomeLuxembourgMacedonia, FYRMalaysiaMaltaMauritiusMexicoMiddle East & North AfricaMiddle East & North Africa (excluding high income)Middle East & North Africa (IDA & IBRD countries)Middle incomeMoldovaMongoliaMontenegroMoroccoMozambiqueMyanmarNamibiaNepalNetherlandsNew ZealandNicaraguaNigerNigeriaNorth AmericaNorwayOECD membersOmanOther small statesPakistanPanamaParaguayPeruPhilippinesPolandPortugalPost-demographic dividendPre-demographic dividendQatarRomaniaRussian FederationSaudi ArabiaSenegalSerbiaSingaporeSlovak RepublicSloveniaSmall statesSouth AfricaSouth AsiaSouth Asia (IDA & IBRD)South SudanSpainSri LankaSub-Saharan Africa Sub-Saharan Africa (excluding high income)Sub-Saharan Africa (IDA & IBRD countries)SudanSwedenSwitzerlandSyrian Arab RepublicTajikistanTanzaniaThailandTogoTrinidad and TobagoTunisiaTurkeyTurkmenistanUkraineUnited Arab EmiratesUnited KingdomUnited StatesUpper middle incomeUruguayUzbekistanVenezuela, RBVietnamWorldYemen, Rep.ZambiaZimbabwe línea de tiempo (timeline):
En esta escala de tiempo se presenta un gráfico de 1986 y 2014 de Mongolia. Los datos de 1985 están ausentes. El número de observaciones reales por fecha: 29.
Fuente (nombre):
Indicadores del desarrollo mundial
Fuente (organización):
IEA Statistics © OECD/IEA 2014 (http://www.iea.org/stats/index.asp), subject to https://www.iea.org/t&c/termsandconditions/
Categorías:
Environment
Se ha actualizado:
23 abr 2017 año
Los indicadores de los cambios de valor en los últimos años
Mínimo:
2.653
1 ene 1997 año
Máximo:
13.231
1 ene 1990 año
A la fecha de observación
Valor
Cambio absoluto
El cambio con respecto al valor anterior
1 ene 1986 año
8.659
+8.659
0.0%
1 ene 1987 año
8.906
+0.248
2.86%
1 ene 1988 año
4.72
-4.186
-47.01%
1 ene 1989 año
7.495
+2.775
58.8%
1 ene 1990 año
13.231
+5.736
76.54%
1 ene 1991 año
6.376
-6.855
-51.81%
1 ene 1992 año
11.096
+4.72
74.02%
1 ene 1993 año
3.822
-7.274
-65.55%
1 ene 1994 año
7.01
+3.188
83.41%
1 ene 1995 año
7.864
+0.854
12.18%
1 ene 1996 año
3.024
-4.84
-61.54%
1 ene 1997 año
2.653
-0.372
-12.29%
1 ene 1998 año
4.829
+2.176
82.04%
1 ene 1999 año
3.286
-1.543
-31.95%
1 ene 2000 año
3.497
+0.21
6.39%
1 ene 2001 año
6.57
+3.074
87.91%
1 ene 2002 año
5.469
-1.101
-16.76%
1 ene 2003 año
6.59
+1.121
20.5%
1 ene 2004 año
7.335
+0.746
11.31%
1 ene 2005 año
6.933
-0.403
-5.49%
1 ene 2006 año
9.909
+2.976
42.93%
1 ene 2007 año
5.272
-4.637
-46.8%
1 ene 2008 año
6.347
+1.075
20.39%
1 ene 2009 año
5.443
-0.904
-14.24%
1 ene 2010 año
11.144
+5.701
104.73%
1 ene 2011 año
10.742
-0.402
-3.61%
1 ene 2012 año
9.365
-1.377
-12.82%
1 ene 2013 año
7.921
-1.444
-15.42%
1 ene 2014 año
9.057
+1.136
14.34%
Ranking de los países por los datos estadísticos actuales


Comentarios: