29
/es/
es
AIzaSyAYiBZKx7MnpbEhh9jyipgxe19OcubqV5w
April 1, 2024
123249
Ecuador
ECU
true
2
1
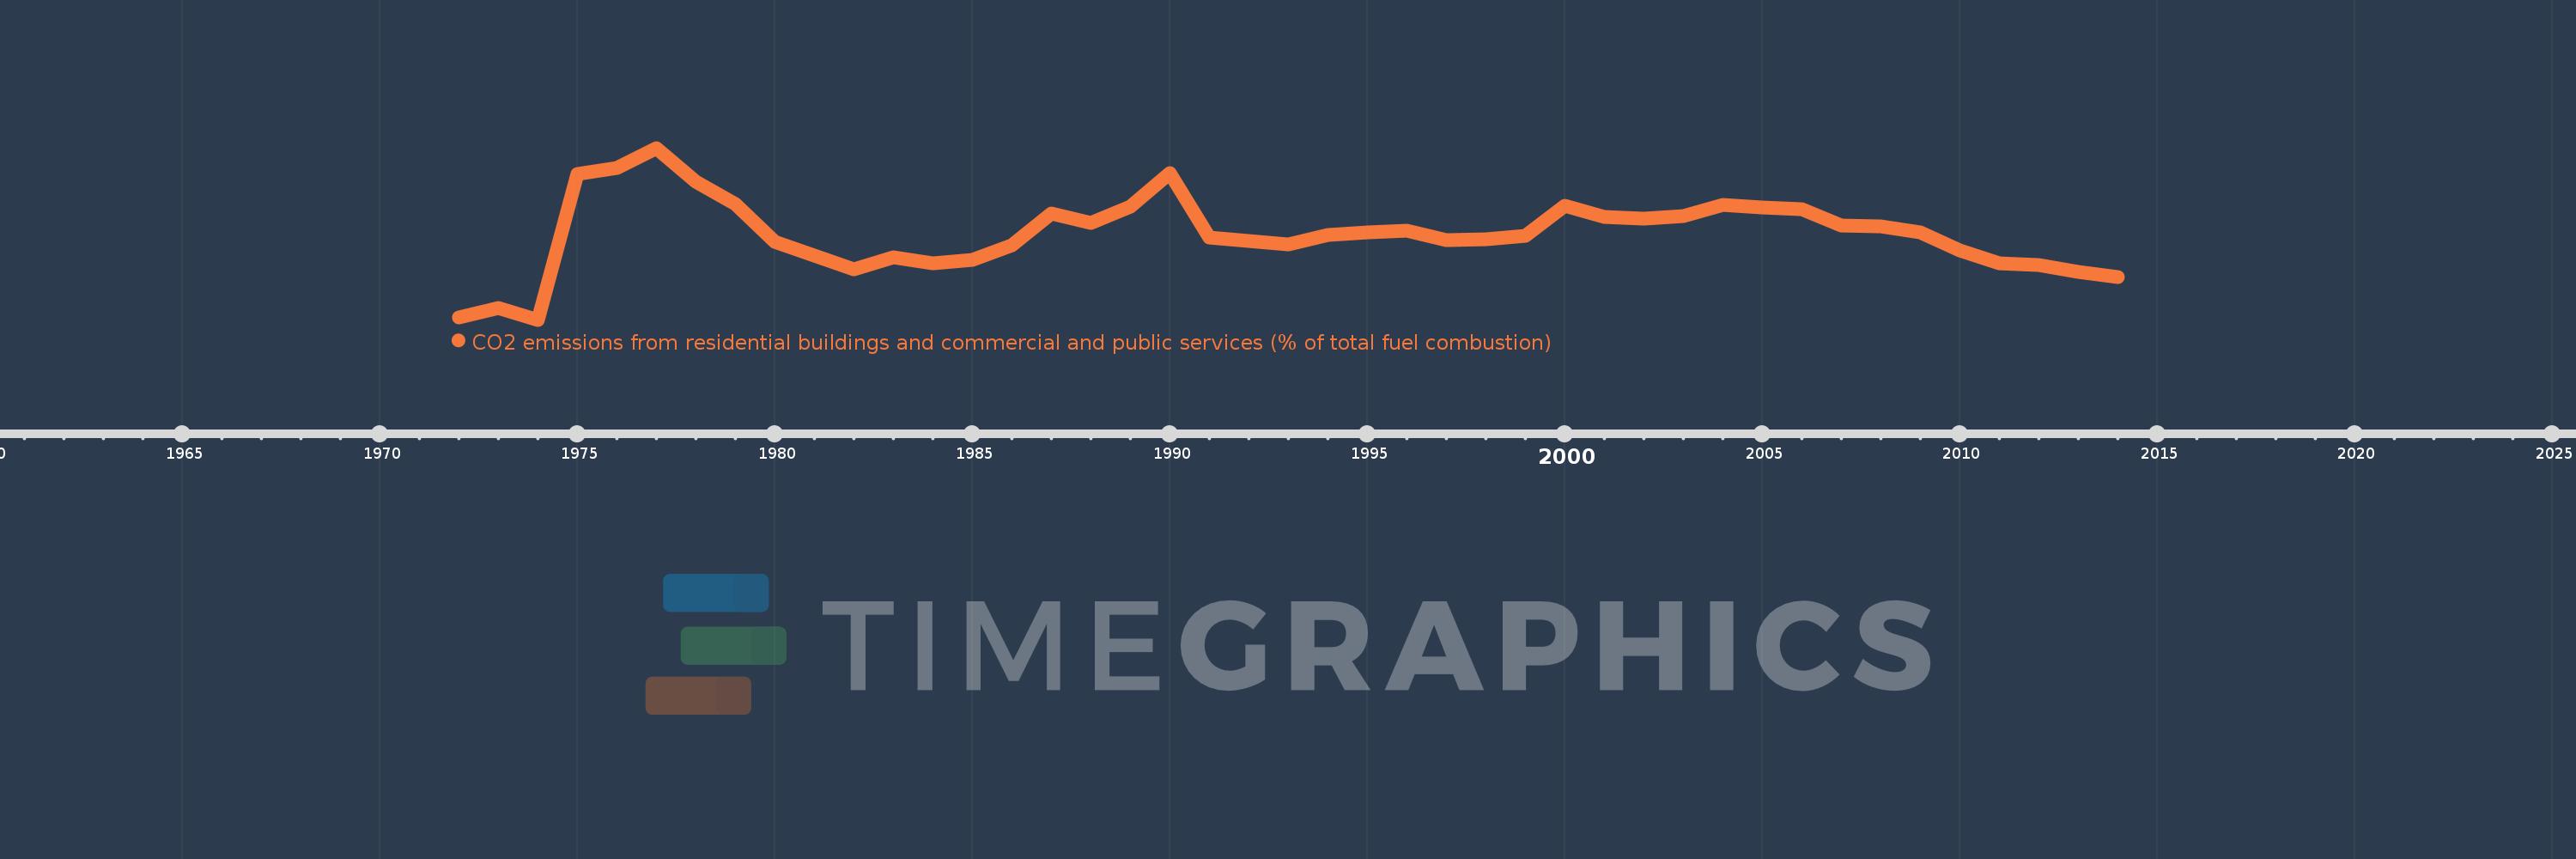
CO2 emissions from residential buildings and commercial and public services (% of total fuel combustion)
2014,2013,2012,2011,2010,2009,2008,2007,2006,2005,2004,2003,2002,2001,2000,1999,1998,1997,1996,1995,1994,1993,1992,1991,1990,1989,1988,1987,1986,1985,1984,1983,1982,1981,1980,1979,1978,1977,1976,1975,1974,1973,1972
Estas estadísticas en otros países:
AlbaniaAlgeriaAngolaArab WorldArgentinaArmeniaAustraliaAustriaAzerbaijanBahrainBangladeshBelarusBelgiumBeninBoliviaBosnia and HerzegovinaBotswanaBrazilBrunei DarussalamBulgariaCambodiaCameroonCanadaCaribbean small statesCentral Europe and the BalticsChileChinaColombiaCongo, Dem. Rep.Congo, Rep.Costa RicaCote d'IvoireCroatiaCubaCuracaoCyprusCzech RepublicDenmarkDominican RepublicEarly-demographic dividendEast Asia & PacificEast Asia & Pacific (excluding high income)East Asia & Pacific (IDA & IBRD countries)EcuadorEgypt, Arab Rep.El SalvadorEritreaEstoniaEthiopiaEuro areaEurope & Central AsiaEurope & Central Asia (excluding high income)Europe & Central Asia (IDA & IBRD countries)European UnionFinlandFragile and conflict affected situationsFranceGabonGeorgiaGermanyGhanaGibraltarGreeceGuatemalaHaitiHeavily indebted poor countries (HIPC)High incomeHondurasHong Kong SAR, ChinaHungaryIBRD onlyIcelandIDA & IBRD totalIDA blendIDA onlyIDA totalIndiaIndonesiaIran, Islamic Rep.IraqIrelandIsraelItalyJamaicaJapanJordanKazakhstanKenyaKorea, Dem. People’s Rep.Korea, Rep.KosovoKuwaitKyrgyz RepublicLate-demographic dividendLatin America & Caribbean Latin America & Caribbean (excluding high income)Latin America & the Caribbean (IDA & IBRD countries)LatviaLeast developed countries: UN classificationLebanonLibyaLithuaniaLow & middle incomeLow incomeLower middle incomeLuxembourgMacedonia, FYRMalaysiaMaltaMauritiusMexicoMiddle East & North AfricaMiddle East & North Africa (excluding high income)Middle East & North Africa (IDA & IBRD countries)Middle incomeMoldovaMongoliaMontenegroMoroccoMozambiqueMyanmarNamibiaNepalNetherlandsNew ZealandNicaraguaNigerNigeriaNorth AmericaNorwayOECD membersOmanOther small statesPakistanPanamaParaguayPeruPhilippinesPolandPortugalPost-demographic dividendPre-demographic dividendQatarRomaniaRussian FederationSaudi ArabiaSenegalSerbiaSingaporeSlovak RepublicSloveniaSmall statesSouth AfricaSouth AsiaSouth Asia (IDA & IBRD)South SudanSpainSri LankaSub-Saharan Africa Sub-Saharan Africa (excluding high income)Sub-Saharan Africa (IDA & IBRD countries)SudanSwedenSwitzerlandSyrian Arab RepublicTajikistanTanzaniaThailandTogoTrinidad and TobagoTunisiaTurkeyTurkmenistanUkraineUnited Arab EmiratesUnited KingdomUnited StatesUpper middle incomeUruguayUzbekistanVenezuela, RBVietnamWorldYemen, Rep.ZambiaZimbabwe línea de tiempo (timeline):
En esta escala de tiempo se presenta un gráfico de 1972 y 2014 de Ecuador. Los datos de 1971 están ausentes. El número de observaciones reales por fecha: 43.
Fuente (nombre):
Indicadores del desarrollo mundial
Fuente (organización):
IEA Statistics © OECD/IEA 2014 (http://www.iea.org/stats/index.asp), subject to https://www.iea.org/t&c/termsandconditions/
Categorías:
Environment
Se ha actualizado:
23 abr 2017 año
Los indicadores de los cambios de valor en los últimos años
Mínimo:
5.038
1 ene 1974 año
Máximo:
14.431
1 ene 1977 año
A la fecha de observación
Valor
Cambio absoluto
El cambio con respecto al valor anterior
1 ene 1972 año
5.158
+5.158
0.0%
1 ene 1973 año
5.682
+0.524
10.16%
1 ene 1974 año
5.038
-0.644
-11.34%
1 ene 1975 año
13.002
+7.964
158.09%
1 ene 1976 año
13.322
+0.32
2.46%
1 ene 1977 año
14.431
+1.109
8.33%
1 ene 1978 año
12.608
-1.823
-12.63%
1 ene 1979 año
11.364
-1.245
-9.87%
1 ene 1980 año
9.278
-2.085
-18.35%
1 ene 1981 año
8.558
-0.721
-7.77%
1 ene 1982 año
7.797
-0.761
-8.89%
1 ene 1983 año
8.46
+0.664
8.51%
1 ene 1984 año
8.115
-0.345
-4.08%
1 ene 1985 año
8.318
+0.203
2.5%
1 ene 1986 año
9.091
+0.772
9.29%
1 ene 1987 año
10.831
+1.74
19.14%
1 ene 1988 año
10.327
-0.504
-4.66%
1 ene 1989 año
11.229
+0.902
8.73%
1 ene 1990 año
13.062
+1.833
16.32%
1 ene 1991 año
9.535
-3.527
-27.0%
1 ene 1992 año
9.346
-0.189
-1.98%
1 ene 1993 año
9.177
-0.169
-1.81%
1 ene 1994 año
9.687
+0.51
5.56%
1 ene 1995 año
9.799
+0.112
1.16%
1 ene 1996 año
9.886
+0.088
0.89%
1 ene 1997 año
9.375
-0.511
-5.17%
1 ene 1998 año
9.447
+0.072
0.77%
1 ene 1999 año
9.608
+0.161
1.7%
1 ene 2000 año
11.259
+1.651
17.19%
1 ene 2001 año
10.645
-0.614
-5.45%
1 ene 2002 año
10.581
-0.064
-0.61%
1 ene 2003 año
10.707
+0.126
1.19%
1 ene 2004 año
11.332
+0.625
5.84%
1 ene 2005 año
11.169
-0.163
-1.44%
1 ene 2006 año
11.073
-0.096
-0.86%
1 ene 2007 año
10.208
-0.865
-7.81%
1 ene 2008 año
10.152
-0.056
-0.55%
1 ene 2009 año
9.818
-0.334
-3.29%
1 ene 2010 año
8.83
-0.988
-10.06%
1 ene 2011 año
8.13
-0.7
-7.93%
1 ene 2012 año
8.018
-0.112
-1.37%
1 ene 2013 año
7.661
-0.358
-4.46%
1 ene 2014 año
7.392
-0.268
-3.5%
Ranking de los países por los datos estadísticos actuales


Comentarios: