29
/es/
es
AIzaSyAYiBZKx7MnpbEhh9jyipgxe19OcubqV5w
April 1, 2024
121881
Dominican Republic
DOM
true
2
1
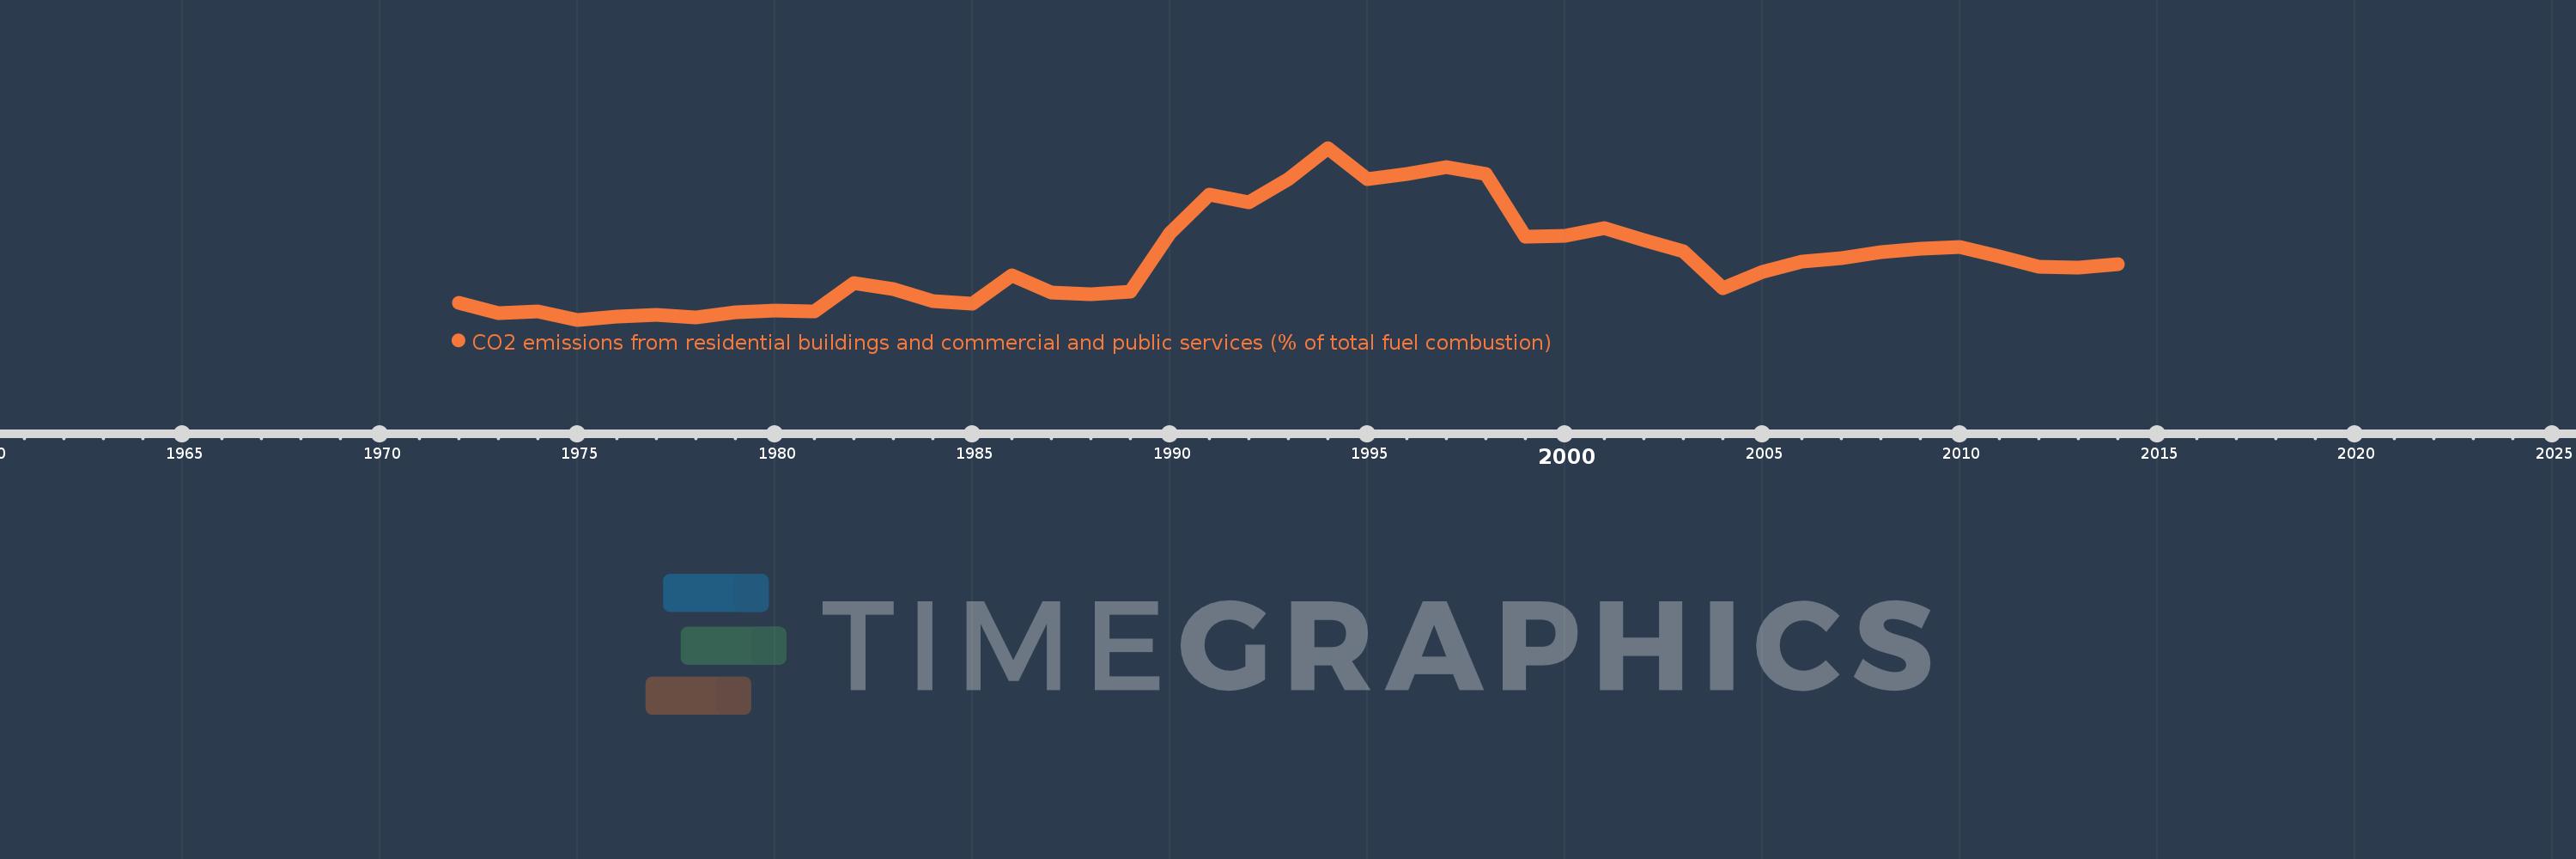
CO2 emissions from residential buildings and commercial and public services (% of total fuel combustion)
2014,2013,2012,2011,2010,2009,2008,2007,2006,2005,2004,2003,2002,2001,2000,1999,1998,1997,1996,1995,1994,1993,1992,1991,1990,1989,1988,1987,1986,1985,1984,1983,1982,1981,1980,1979,1978,1977,1976,1975,1974,1973,1972
Estas estadísticas en otros países:
AlbaniaAlgeriaAngolaArab WorldArgentinaArmeniaAustraliaAustriaAzerbaijanBahrainBangladeshBelarusBelgiumBeninBoliviaBosnia and HerzegovinaBotswanaBrazilBrunei DarussalamBulgariaCambodiaCameroonCanadaCaribbean small statesCentral Europe and the BalticsChileChinaColombiaCongo, Dem. Rep.Congo, Rep.Costa RicaCote d'IvoireCroatiaCubaCuracaoCyprusCzech RepublicDenmarkDominican RepublicEarly-demographic dividendEast Asia & PacificEast Asia & Pacific (excluding high income)East Asia & Pacific (IDA & IBRD countries)EcuadorEgypt, Arab Rep.El SalvadorEritreaEstoniaEthiopiaEuro areaEurope & Central AsiaEurope & Central Asia (excluding high income)Europe & Central Asia (IDA & IBRD countries)European UnionFinlandFragile and conflict affected situationsFranceGabonGeorgiaGermanyGhanaGibraltarGreeceGuatemalaHaitiHeavily indebted poor countries (HIPC)High incomeHondurasHong Kong SAR, ChinaHungaryIBRD onlyIcelandIDA & IBRD totalIDA blendIDA onlyIDA totalIndiaIndonesiaIran, Islamic Rep.IraqIrelandIsraelItalyJamaicaJapanJordanKazakhstanKenyaKorea, Dem. People’s Rep.Korea, Rep.KosovoKuwaitKyrgyz RepublicLate-demographic dividendLatin America & Caribbean Latin America & Caribbean (excluding high income)Latin America & the Caribbean (IDA & IBRD countries)LatviaLeast developed countries: UN classificationLebanonLibyaLithuaniaLow & middle incomeLow incomeLower middle incomeLuxembourgMacedonia, FYRMalaysiaMaltaMauritiusMexicoMiddle East & North AfricaMiddle East & North Africa (excluding high income)Middle East & North Africa (IDA & IBRD countries)Middle incomeMoldovaMongoliaMontenegroMoroccoMozambiqueMyanmarNamibiaNepalNetherlandsNew ZealandNicaraguaNigerNigeriaNorth AmericaNorwayOECD membersOmanOther small statesPakistanPanamaParaguayPeruPhilippinesPolandPortugalPost-demographic dividendPre-demographic dividendQatarRomaniaRussian FederationSaudi ArabiaSenegalSerbiaSingaporeSlovak RepublicSloveniaSmall statesSouth AfricaSouth AsiaSouth Asia (IDA & IBRD)South SudanSpainSri LankaSub-Saharan Africa Sub-Saharan Africa (excluding high income)Sub-Saharan Africa (IDA & IBRD countries)SudanSwedenSwitzerlandSyrian Arab RepublicTajikistanTanzaniaThailandTogoTrinidad and TobagoTunisiaTurkeyTurkmenistanUkraineUnited Arab EmiratesUnited KingdomUnited StatesUpper middle incomeUruguayUzbekistanVenezuela, RBVietnamWorldYemen, Rep.ZambiaZimbabwe línea de tiempo (timeline):
En esta escala de tiempo se presenta un gráfico de 1972 y 2014 de Dominican Republic. Los datos de 1971 están ausentes. El número de observaciones reales por fecha: 43.
Fuente (nombre):
Indicadores del desarrollo mundial
Fuente (organización):
IEA Statistics © OECD/IEA 2014 (http://www.iea.org/stats/index.asp), subject to https://www.iea.org/t&c/termsandconditions/
Categorías:
Environment
Se ha actualizado:
23 abr 2017 año
Los indicadores de los cambios de valor en los últimos años
Máximo:
16.276
1 ene 1994 año
A la fecha de observación
Valor
Cambio absoluto
El cambio con respecto al valor anterior
1 ene 1972 año
4.31
+4.31
0.0%
1 ene 1973 año
3.501
-0.809
-18.77%
1 ene 1974 año
3.672
+0.171
4.87%
1 ene 1975 año
3.0
-0.672
-18.29%
1 ene 1976 año
3.263
+0.263
8.77%
1 ene 1977 año
3.364
+0.102
3.11%
1 ene 1978 año
3.169
-0.195
-5.81%
1 ene 1979 año
3.602
+0.433
13.66%
1 ene 1980 año
3.74
+0.138
3.83%
1 ene 1981 año
3.633
-0.106
-2.84%
1 ene 1982 año
5.833
+2.2
60.54%
1 ene 1983 año
5.354
-0.479
-8.22%
1 ene 1984 año
4.444
-0.91
-16.99%
1 ene 1985 año
4.243
-0.201
-4.53%
1 ene 1986 año
6.421
+2.177
51.31%
1 ene 1987 año
5.099
-1.321
-20.58%
1 ene 1988 año
4.95
-0.149
-2.92%
1 ene 1989 año
5.166
+0.216
4.35%
1 ene 1990 año
9.7
+4.534
87.76%
1 ene 1991 año
12.703
+3.003
30.96%
1 ene 1992 año
12.094
-0.609
-4.79%
1 ene 1993 año
13.843
+1.749
14.46%
1 ene 1994 año
16.276
+2.434
17.58%
1 ene 1995 año
13.894
-2.382
-14.64%
1 ene 1996 año
14.273
+0.379
2.73%
1 ene 1997 año
14.809
+0.536
3.75%
1 ene 1998 año
14.296
-0.513
-3.46%
1 ene 1999 año
9.418
-4.878
-34.12%
1 ene 2000 año
9.483
+0.064
0.68%
1 ene 2001 año
10.056
+0.573
6.04%
1 ene 2002 año
9.159
-0.896
-8.91%
1 ene 2003 año
8.319
-0.84
-9.17%
1 ene 2004 año
5.438
-2.881
-34.63%
1 ene 2005 año
6.667
+1.229
22.59%
1 ene 2006 año
7.516
+0.849
12.74%
1 ene 2007 año
7.734
+0.218
2.9%
1 ene 2008 año
8.224
+0.49
6.34%
1 ene 2009 año
8.518
+0.293
3.56%
1 ene 2010 año
8.648
+0.131
1.53%
1 ene 2011 año
7.874
-0.774
-8.95%
1 ene 2012 año
7.102
-0.772
-9.8%
1 ene 2013 año
7.007
-0.095
-1.34%
1 ene 2014 año
7.263
+0.256
3.65%
Ranking de los países por los datos estadísticos actuales


Comentarios: