29
/es/
es
AIzaSyAYiBZKx7MnpbEhh9jyipgxe19OcubqV5w
April 1, 2024
197468
Moldova
MDA
true
2
1
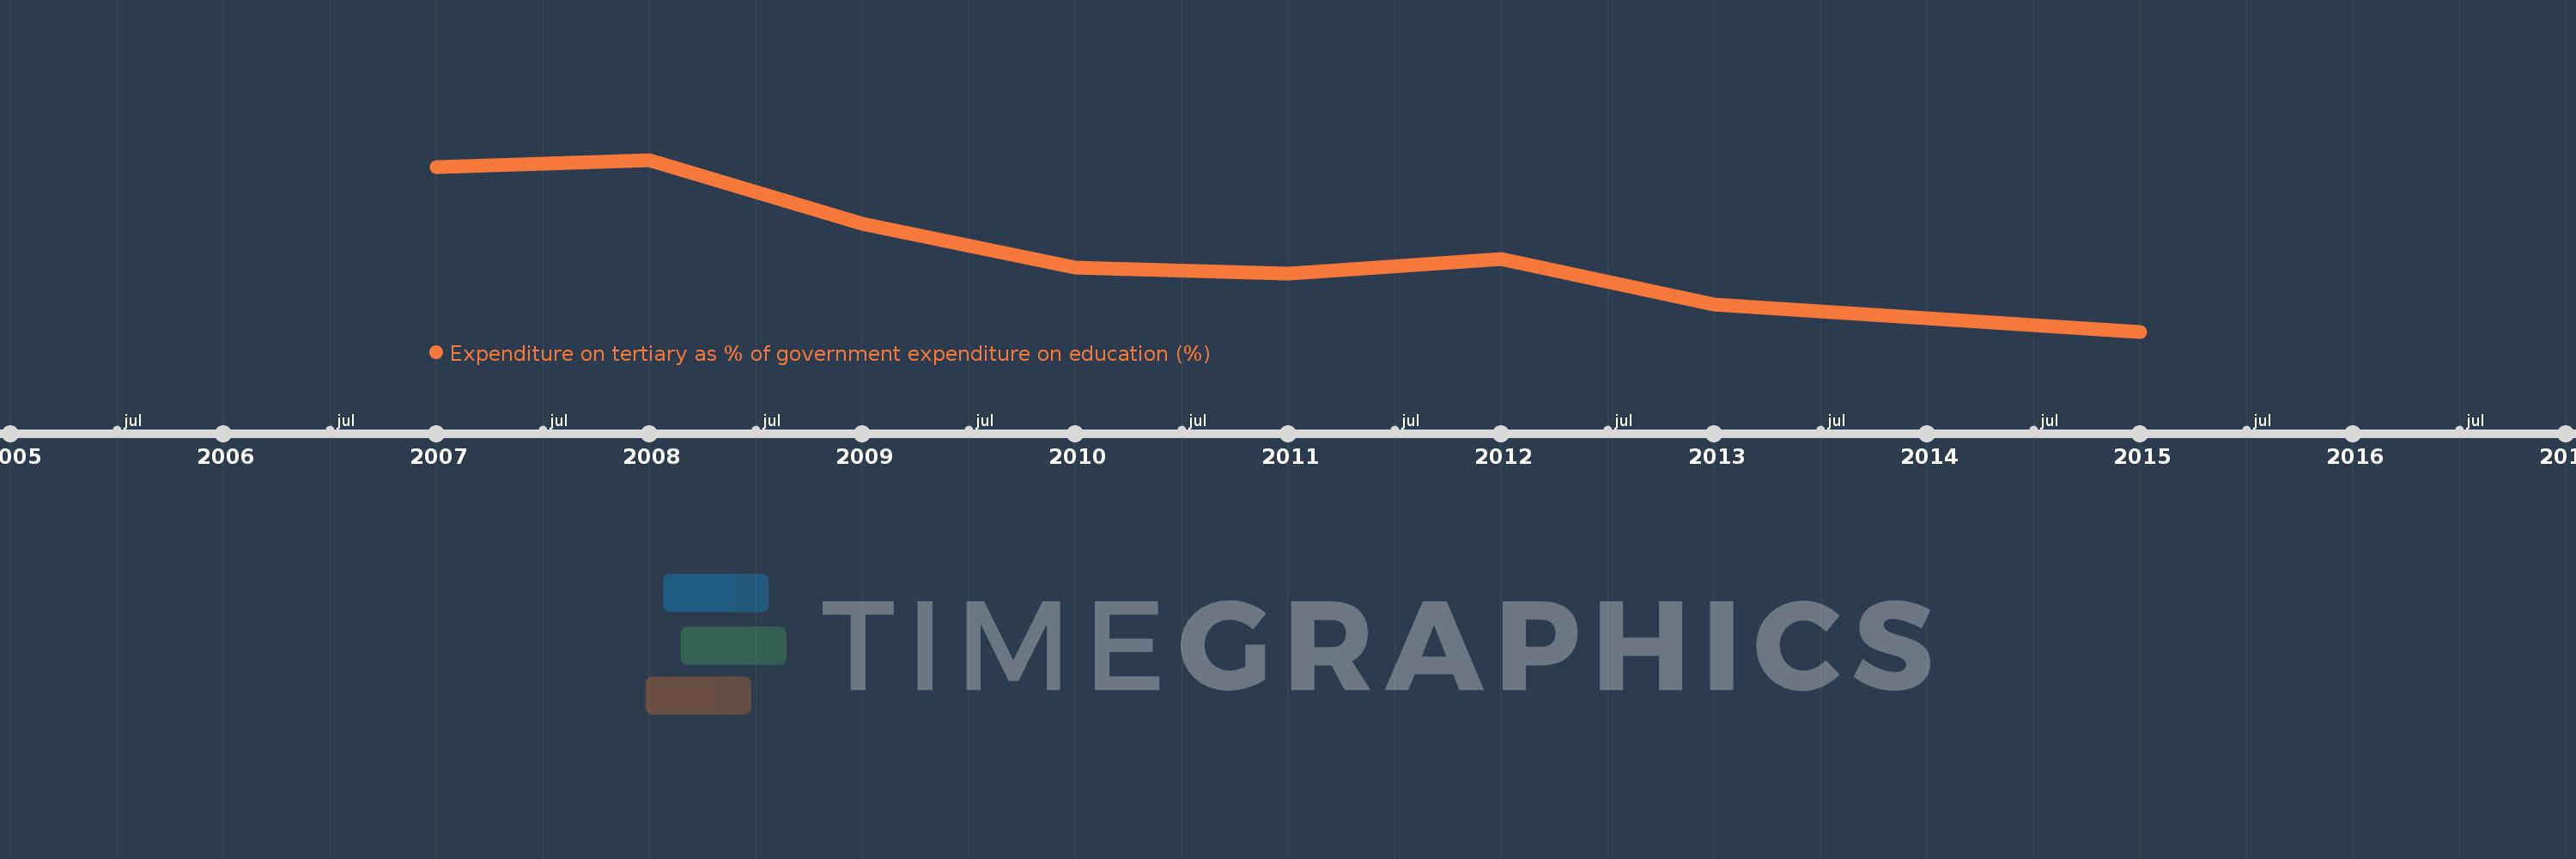
Expenditure on tertiary as % of government expenditure on education (%)
2015,2013,2012,2011,2010,2009,2008,2007
Estas estadísticas en otros países:
línea de tiempo (timeline):
En esta escala de tiempo se presenta un gráfico de 2007 y 2015 de Moldova. Los datos de 2006 están ausentes. El número de observaciones reales por fecha: 8.
Fuente (nombre):
Indicadores del desarrollo mundial
Fuente (organización):
UNESCO Institute for Statistics
Categorías:
Education
Se ha actualizado:
23 abr 2017 año
Los indicadores de los cambios de valor en los últimos años
Mínimo:
17.195
1 ene 2015 año
Máximo:
19.51
1 ene 2008 año
A la fecha de observación
Valor
Cambio absoluto
El cambio con respecto al valor anterior
1 ene 2007 año
19.415
+19.415
0.0%
1 ene 2008 año
19.51
+0.095
0.49%
1 ene 2009 año
18.645
-0.865
-4.43%
1 ene 2010 año
18.059
-0.587
-3.15%
1 ene 2011 año
17.976
-0.082
-0.46%
1 ene 2012 año
18.174
+0.198
1.1%
1 ene 2013 año
17.563
-0.611
-3.36%
1 ene 2015 año
17.195
-0.368
-2.1%
Ranking de los países por los datos estadísticos actuales


Comentarios: