29
/es/
es
AIzaSyAYiBZKx7MnpbEhh9jyipgxe19OcubqV5w
April 1, 2024
27238
East Asia & Pacific
EAS
false
2
1
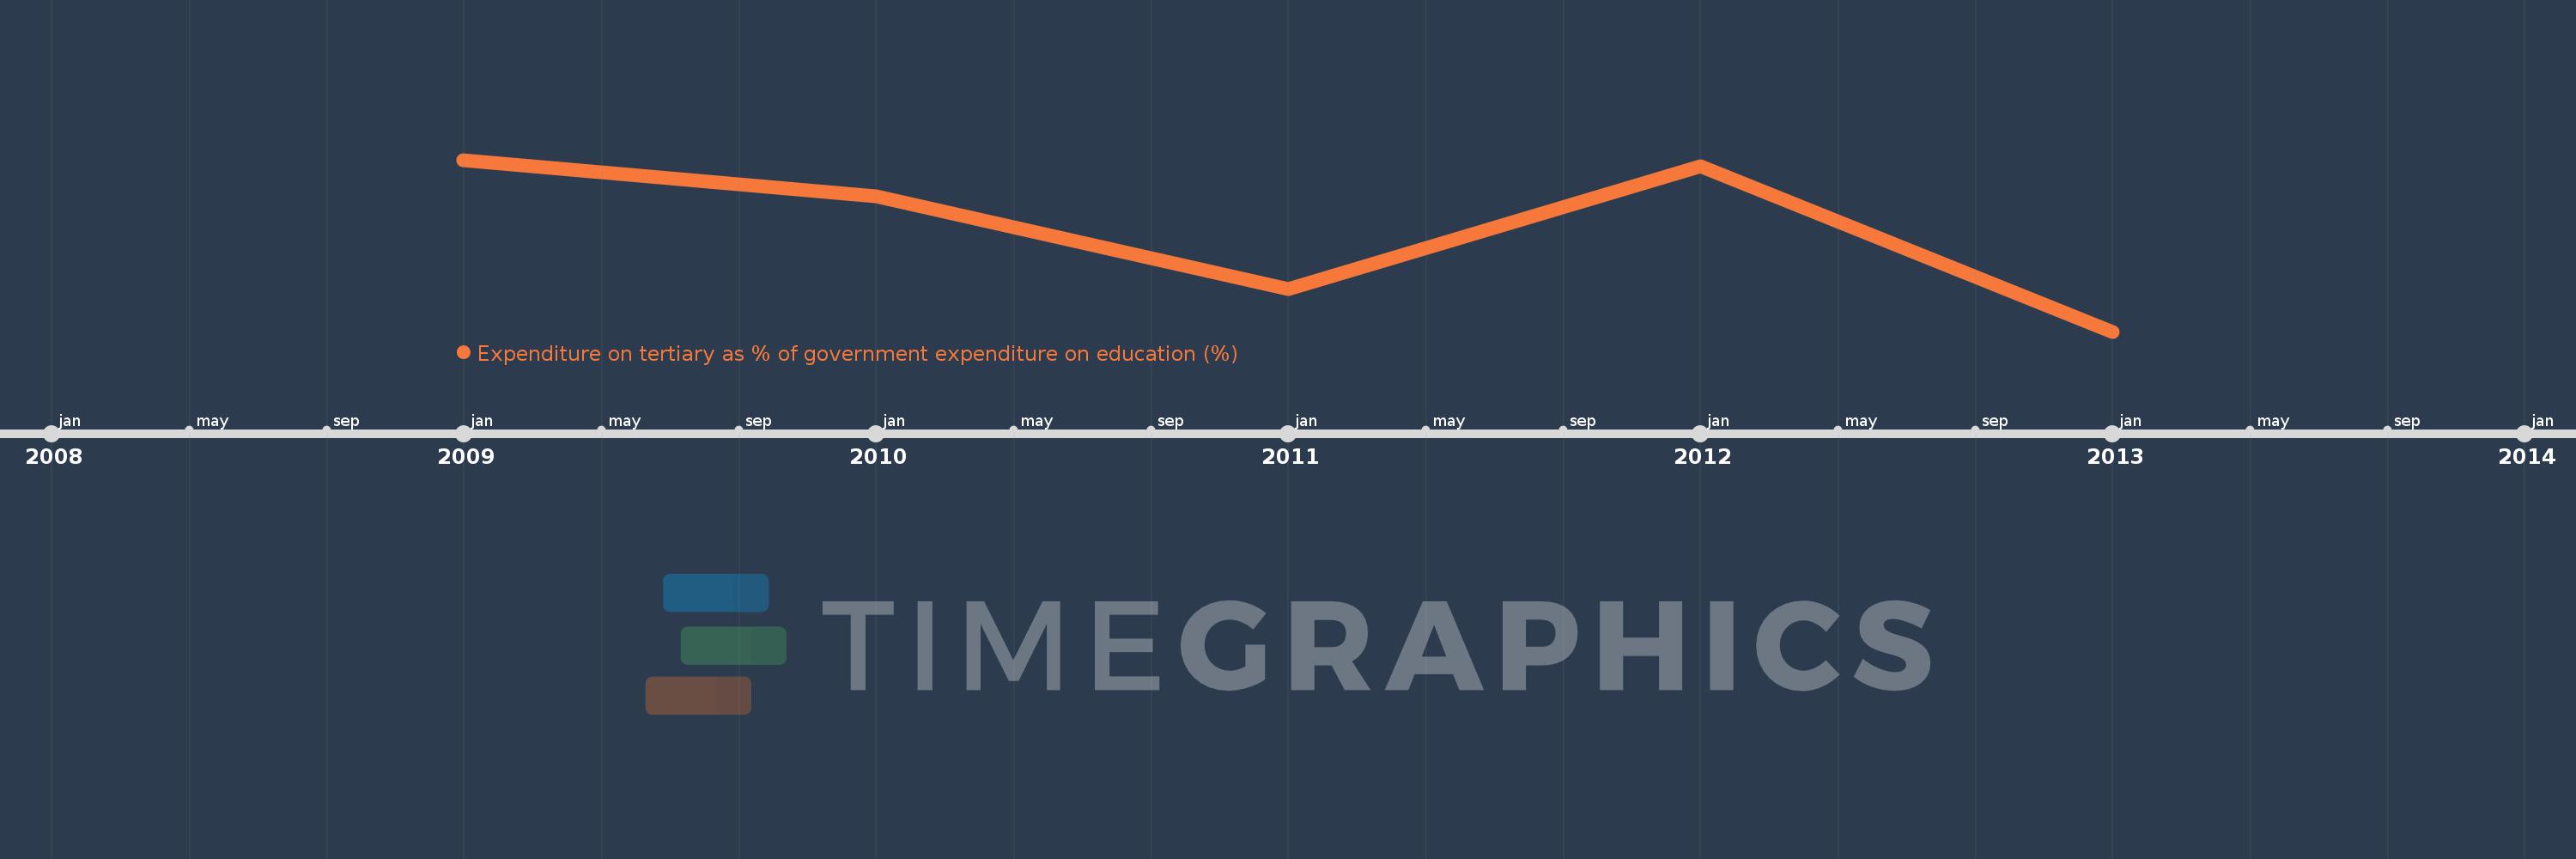
Expenditure on tertiary as % of government expenditure on education (%)
2013,2012,2011,2010,2009
Estas estadísticas en otros países:
línea de tiempo (timeline):
En esta escala de tiempo se presenta un gráfico de 2009 y 2013 de East Asia & Pacific. Los datos de 2008 están ausentes. El número de observaciones reales por fecha: 5.
Fuente (nombre):
Indicadores del desarrollo mundial
Fuente (organización):
UNESCO Institute for Statistics
Categorías:
Education
Se ha actualizado:
23 abr 2017 año
Los indicadores de los cambios de valor en los últimos años
Mínimo:
17.178
1 ene 2013 año
Máximo:
21.67
1 ene 2009 año
A la fecha de observación
Valor
Cambio absoluto
El cambio con respecto al valor anterior
1 ene 2009 año
21.67
+21.67
0.0%
1 ene 2010 año
20.715
-0.955
-4.41%
1 ene 2011 año
18.298
-2.418
-11.67%
1 ene 2012 año
21.496
+3.199
17.48%
1 ene 2013 año
17.178
-4.319
-20.09%
Ranking de los países por los datos estadísticos actuales


Comentarios: