29
/es/
es
AIzaSyAYiBZKx7MnpbEhh9jyipgxe19OcubqV5w
April 1, 2024
196216
Mexico
MEX
true
2
1
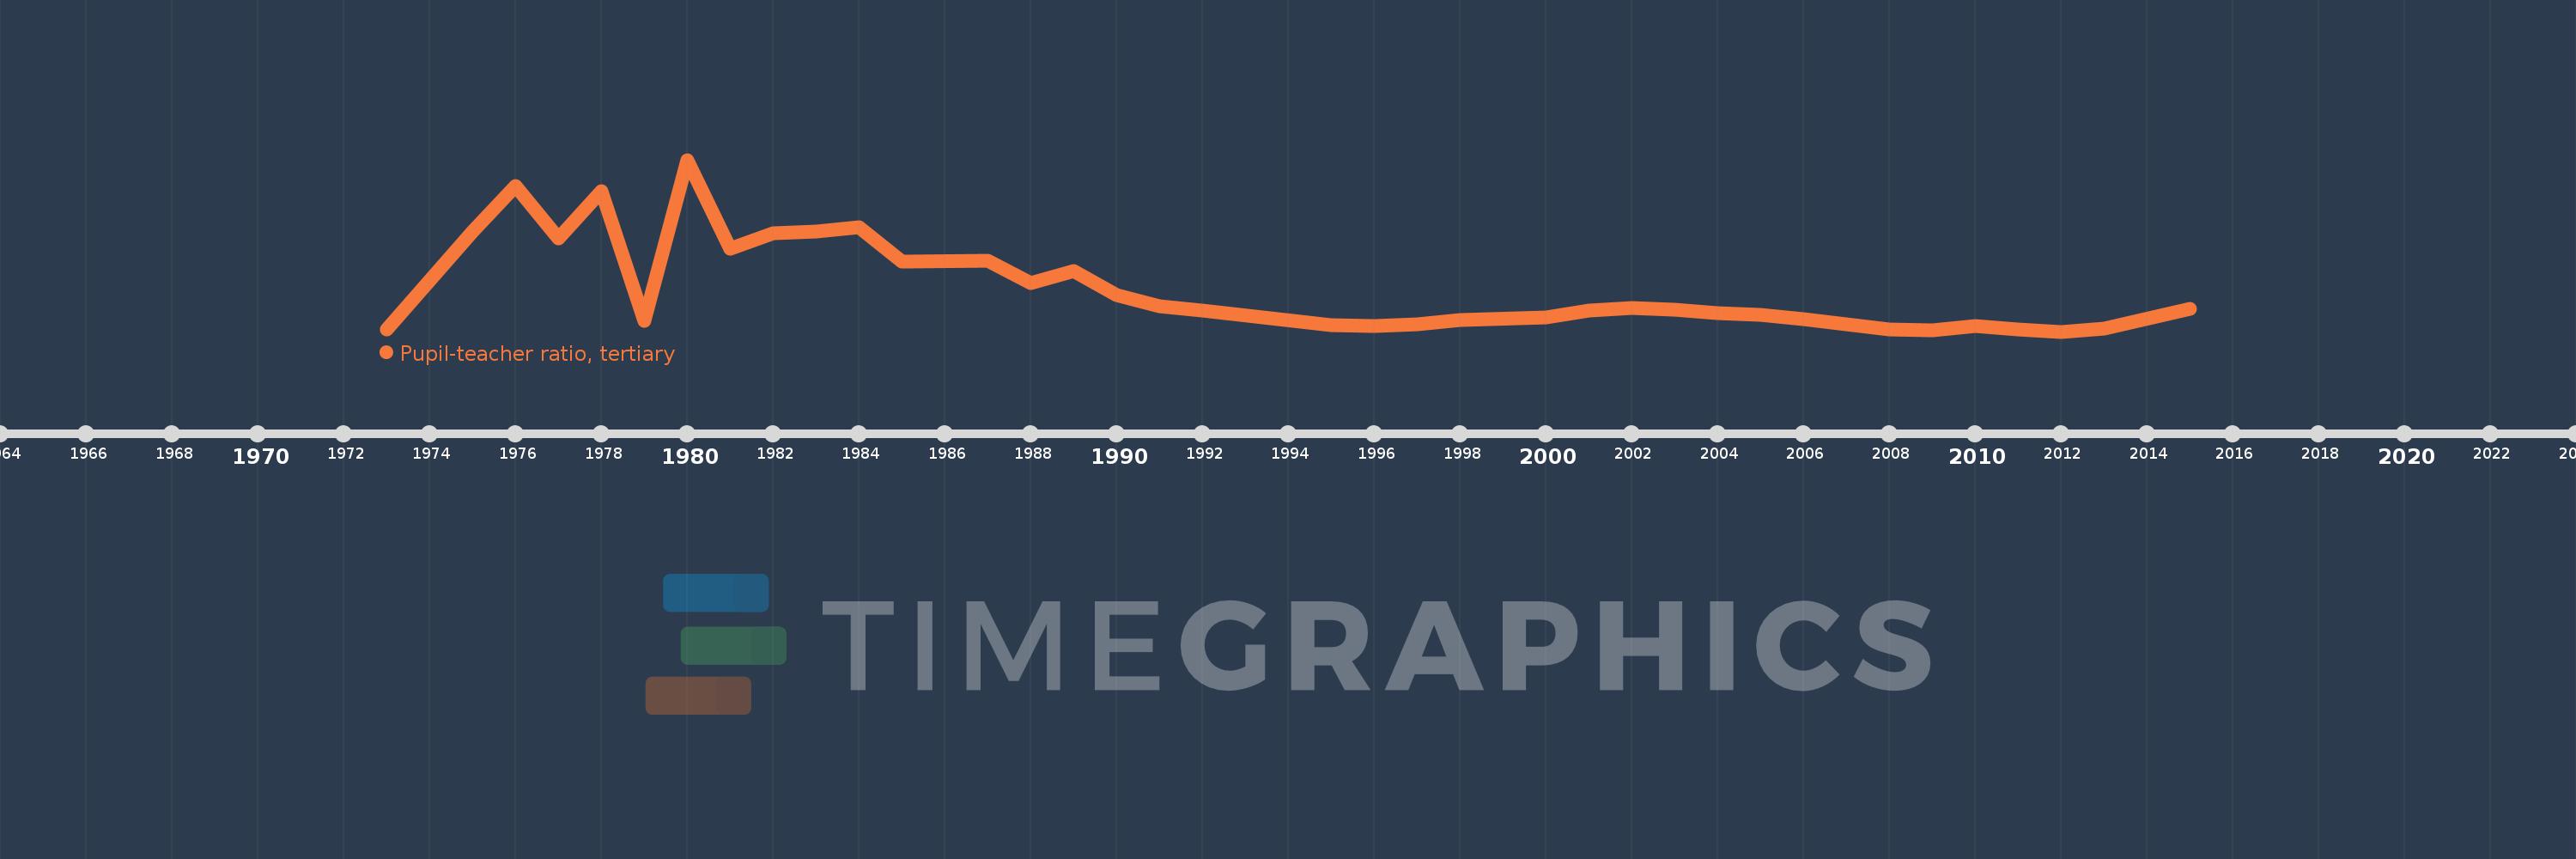
Pupil-teacher ratio, tertiary
2015,2013,2012,2011,2010,2009,2008,2007,2006,2005,2004,2003,2002,2001,2000,1998,1997,1996,1995,1992,1991,1990,1989,1988,1987,1985,1984,1983,1982,1981,1980,1979,1978,1977,1976,1975,1973
Estas estadísticas en otros países:
AfghanistanAlbaniaAlgeriaAndorraAngolaAntigua and BarbudaArgentinaArmeniaArubaAustraliaAustriaAzerbaijanBahamas, TheBahrainBangladeshBarbadosBelarusBelgiumBelizeBeninBermudaBhutanBoliviaBosnia and HerzegovinaBotswanaBrazilBritish Virgin IslandsBrunei DarussalamBulgariaBurkina FasoBurundiCabo VerdeCambodiaCameroonCanadaCayman IslandsCentral African RepublicChadChileChinaColombiaComorosCongo, Dem. Rep.Congo, Rep.Costa RicaCote d'IvoireCroatiaCubaCyprusCzech RepublicDenmarkDjiboutiDominicaDominican RepublicEcuadorEgypt, Arab Rep.El SalvadorEquatorial GuineaEritreaEstoniaEthiopiaFijiFinlandFranceGabonGambia, TheGeorgiaGermanyGhanaGreeceGrenadaGuatemalaGuineaGuinea-BissauGuyanaHaitiHondurasHong Kong SAR, ChinaHungaryIcelandIndiaIndonesiaIran, Islamic Rep.IraqIrelandIsraelItalyJamaicaJapanJordanKazakhstanKorea, Dem. People’s Rep.Korea, Rep.KuwaitKyrgyz RepublicLao PDRLatviaLebanonLesothoLiberiaLibyaLiechtensteinLithuaniaLuxembourgMacao SAR, ChinaMacedonia, FYRMadagascarMalawiMalaysiaMaldivesMaliMaltaMarshall IslandsMauritaniaMauritiusMexicoMicronesia, Fed. Sts.MoldovaMongoliaMoroccoMozambiqueMyanmarNamibiaNepalNetherlandsNew ZealandNicaraguaNigerNigeriaNorwayOmanPakistanPalauPanamaPapua New GuineaParaguayPeruPhilippinesPolandPortugalPuerto RicoQatarRomaniaRussian FederationRwandaSamoaSao Tome and PrincipeSaudi ArabiaSenegalSerbiaSeychellesSierra LeoneSingaporeSint Maarten (Dutch part)Slovak RepublicSloveniaSomaliaSouth AfricaSpainSri LankaSt. Kitts and NevisSt. LuciaSt. Vincent and the GrenadinesSudanSurinameSwazilandSwedenSwitzerlandSyrian Arab RepublicTajikistanTanzaniaThailandTimor-LesteTogoTongaTrinidad and TobagoTunisiaTurkeyTurkmenistanUgandaUkraineUnited Arab EmiratesUnited KingdomUnited StatesUruguayUzbekistanVanuatuVenezuela, RBVietnamWest Bank and GazaYemen, Rep.ZambiaZimbabwe línea de tiempo (timeline):
En esta escala de tiempo se presenta un gráfico de 1973 y 2015 de Mexico. Los datos de 1972 están ausentes. El número de observaciones reales por fecha: 37.
Fuente (nombre):
Indicadores del desarrollo mundial
Fuente (organización):
United Nations Educational, Scientific, and Cultural Organization (UNESCO) Institute for Statistics.
Categorías:
Education
Se ha actualizado:
23 abr 2017 año
Los indicadores de los cambios de valor en los últimos años
Mínimo:
9.137
1 ene 2012 año
Máximo:
14.101
1 ene 1980 año
A la fecha de observación
Valor
Cambio absoluto
El cambio con respecto al valor anterior
1 ene 1973 año
9.21
+9.21
0.0%
1 ene 1975 año
12.031
+2.821
30.62%
1 ene 1976 año
13.334
+1.303
10.83%
1 ene 1977 año
11.826
-1.508
-11.31%
1 ene 1978 año
13.204
+1.378
11.65%
1 ene 1979 año
9.455
-3.748
-28.39%
1 ene 1980 año
14.101
+4.646
49.13%
1 ene 1981 año
11.528
-2.574
-18.25%
1 ene 1982 año
11.975
+0.447
3.88%
1 ene 1983 año
12.034
+0.059
0.49%
1 ene 1984 año
12.145
+0.111
0.92%
1 ene 1985 año
11.149
-0.995
-8.2%
1 ene 1987 año
11.183
+0.033
0.3%
1 ene 1988 año
10.544
-0.639
-5.72%
1 ene 1989 año
10.896
+0.352
3.34%
1 ene 1990 año
10.196
-0.701
-6.43%
1 ene 1991 año
9.875
-0.321
-3.15%
1 ene 1992 año
9.752
-0.123
-1.25%
1 ene 1995 año
9.317
-0.435
-4.46%
1 ene 1996 año
9.307
-0.01
-0.11%
1 ene 1997 año
9.356
+0.049
0.53%
1 ene 1998 año
9.465
+0.109
1.17%
1 ene 2000 año
9.552
+0.087
0.92%
1 ene 2001 año
9.739
+0.187
1.96%
1 ene 2002 año
9.813
+0.074
0.76%
1 ene 2003 año
9.768
-0.045
-0.46%
1 ene 2004 año
9.66
-0.108
-1.11%
1 ene 2005 año
9.629
-0.031
-0.32%
1 ene 2006 año
9.492
-0.137
-1.42%
1 ene 2007 año
9.343
-0.149
-1.57%
1 ene 2008 año
9.208
-0.135
-1.44%
1 ene 2009 año
9.174
-0.034
-0.37%
1 ene 2010 año
9.288
+0.114
1.24%
1 ene 2011 año
9.187
-0.101
-1.09%
1 ene 2012 año
9.137
-0.05
-0.54%
1 ene 2013 año
9.236
+0.099
1.09%
1 ene 2015 año
9.792
+0.556
6.02%
Ranking de los países por los datos estadísticos actuales


Comentarios: