29
/es/
es
AIzaSyAYiBZKx7MnpbEhh9jyipgxe19OcubqV5w
April 1, 2024
170435
Korea, Rep.
KOR
true
2
1
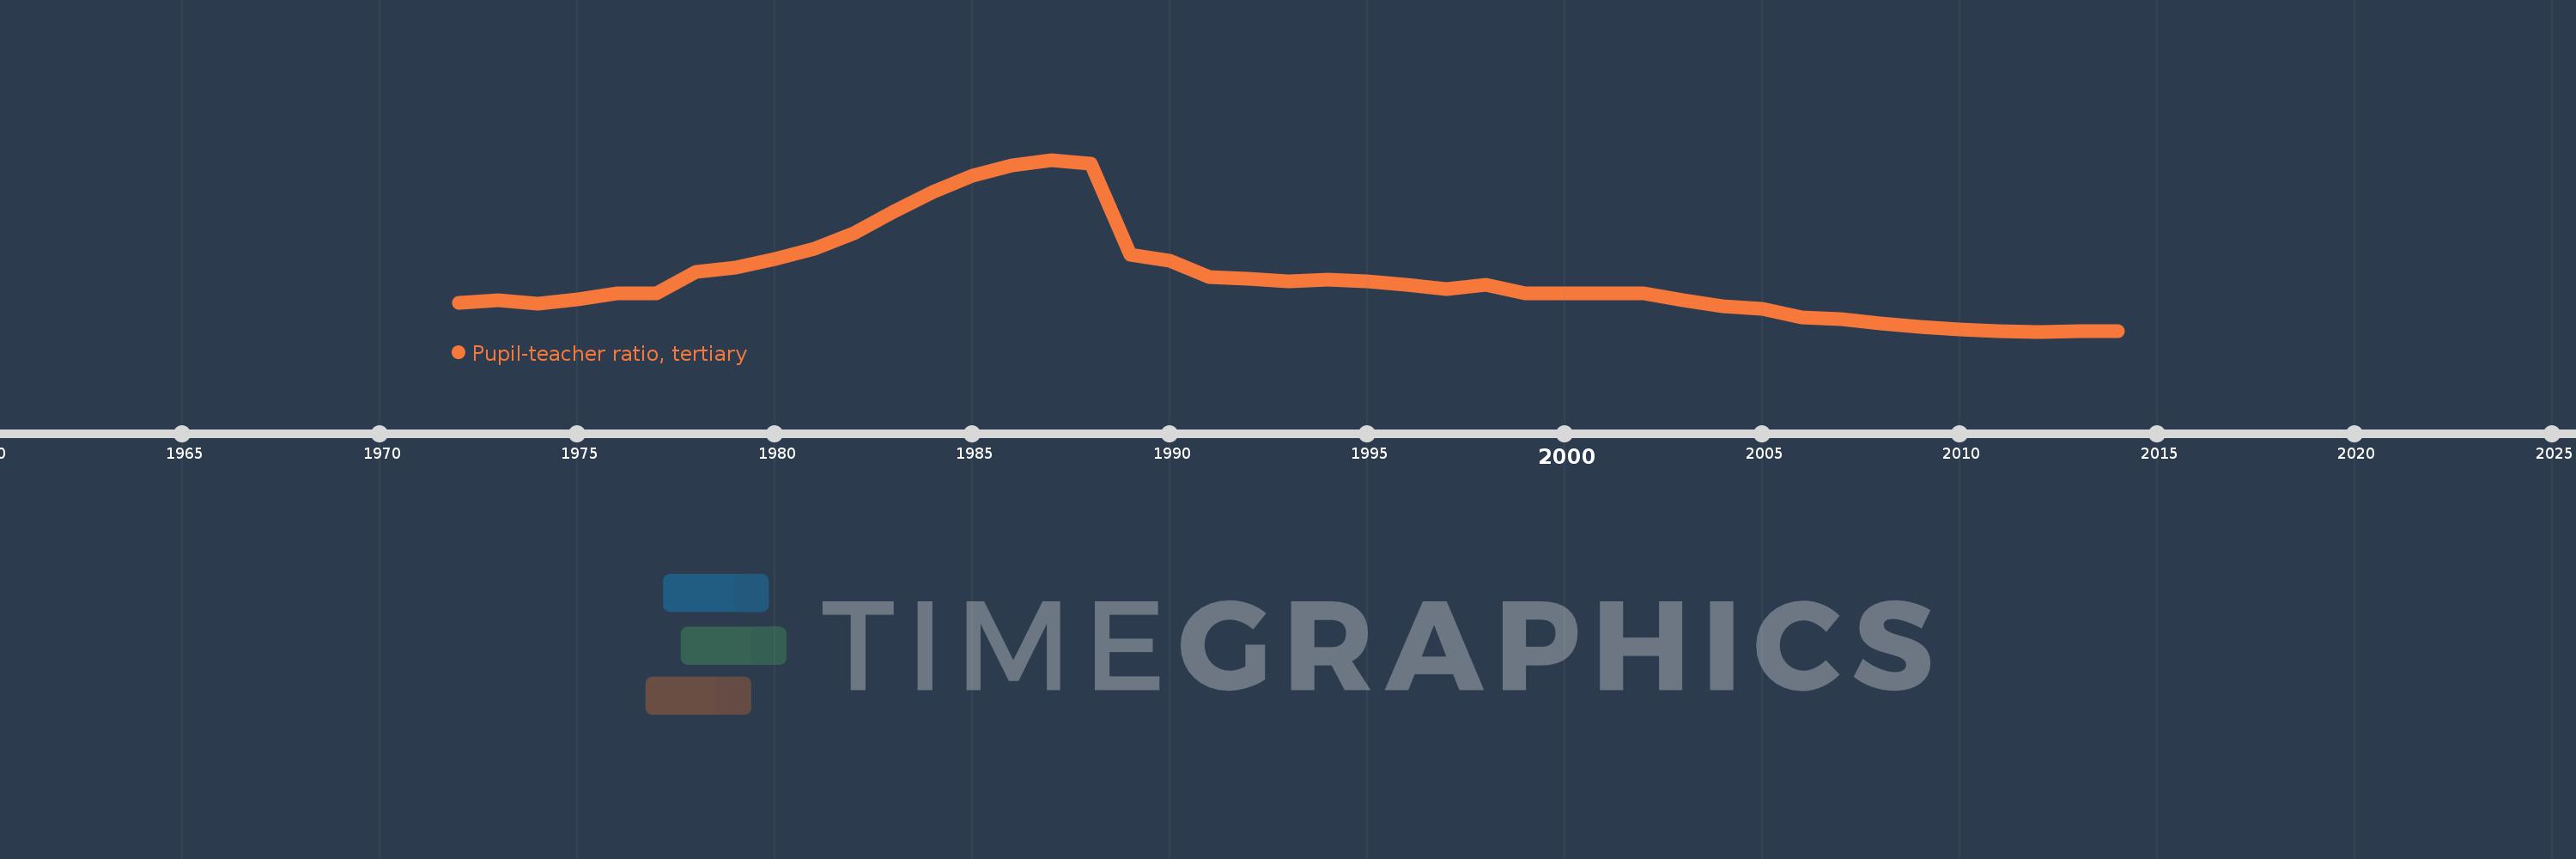
Pupil-teacher ratio, tertiary
2014,2013,2012,2011,2010,2009,2008,2007,2006,2005,2004,2003,2002,2001,2000,1999,1998,1997,1996,1995,1994,1993,1992,1991,1990,1989,1988,1987,1986,1985,1984,1983,1982,1981,1980,1979,1978,1977,1976,1975,1974,1973,1972
Estas estadísticas en otros países:
AfghanistanAlbaniaAlgeriaAndorraAngolaAntigua and BarbudaArgentinaArmeniaArubaAustraliaAustriaAzerbaijanBahamas, TheBahrainBangladeshBarbadosBelarusBelgiumBelizeBeninBermudaBhutanBoliviaBosnia and HerzegovinaBotswanaBrazilBritish Virgin IslandsBrunei DarussalamBulgariaBurkina FasoBurundiCabo VerdeCambodiaCameroonCanadaCayman IslandsCentral African RepublicChadChileChinaColombiaComorosCongo, Dem. Rep.Congo, Rep.Costa RicaCote d'IvoireCroatiaCubaCyprusCzech RepublicDenmarkDjiboutiDominicaDominican RepublicEcuadorEgypt, Arab Rep.El SalvadorEquatorial GuineaEritreaEstoniaEthiopiaFijiFinlandFranceGabonGambia, TheGeorgiaGermanyGhanaGreeceGrenadaGuatemalaGuineaGuinea-BissauGuyanaHaitiHondurasHong Kong SAR, ChinaHungaryIcelandIndiaIndonesiaIran, Islamic Rep.IraqIrelandIsraelItalyJamaicaJapanJordanKazakhstanKorea, Dem. People’s Rep.Korea, Rep.KuwaitKyrgyz RepublicLao PDRLatviaLebanonLesothoLiberiaLibyaLiechtensteinLithuaniaLuxembourgMacao SAR, ChinaMacedonia, FYRMadagascarMalawiMalaysiaMaldivesMaliMaltaMarshall IslandsMauritaniaMauritiusMexicoMicronesia, Fed. Sts.MoldovaMongoliaMoroccoMozambiqueMyanmarNamibiaNepalNetherlandsNew ZealandNicaraguaNigerNigeriaNorwayOmanPakistanPalauPanamaPapua New GuineaParaguayPeruPhilippinesPolandPortugalPuerto RicoQatarRomaniaRussian FederationRwandaSamoaSao Tome and PrincipeSaudi ArabiaSenegalSerbiaSeychellesSierra LeoneSingaporeSint Maarten (Dutch part)Slovak RepublicSloveniaSomaliaSouth AfricaSpainSri LankaSt. Kitts and NevisSt. LuciaSt. Vincent and the GrenadinesSudanSurinameSwazilandSwedenSwitzerlandSyrian Arab RepublicTajikistanTanzaniaThailandTimor-LesteTogoTongaTrinidad and TobagoTunisiaTurkeyTurkmenistanUgandaUkraineUnited Arab EmiratesUnited KingdomUnited StatesUruguayUzbekistanVanuatuVenezuela, RBVietnamWest Bank and GazaYemen, Rep.ZambiaZimbabwe línea de tiempo (timeline):
En esta escala de tiempo se presenta un gráfico de 1972 y 2014 de Korea, Rep.. Los datos de 1971 están ausentes. El número de observaciones reales por fecha: 43.
Fuente (nombre):
Indicadores del desarrollo mundial
Fuente (organización):
United Nations Educational, Scientific, and Cultural Organization (UNESCO) Institute for Statistics.
Categorías:
Education
Se ha actualizado:
23 abr 2017 año
Los indicadores de los cambios de valor en los últimos años
Mínimo:
14.588
1 ene 2012 año
Máximo:
42.442
1 ene 1987 año
A la fecha de observación
Valor
Cambio absoluto
El cambio con respecto al valor anterior
1 ene 1972 año
19.304
+19.304
0.0%
1 ene 1973 año
19.65
+0.346
1.79%
1 ene 1974 año
19.08
-0.57
-2.9%
1 ene 1975 año
19.748
+0.669
3.51%
1 ene 1976 año
20.791
+1.042
5.28%
1 ene 1977 año
20.806
+0.015
0.07%
1 ene 1978 año
24.25
+3.444
16.55%
1 ene 1979 año
24.974
+0.724
2.99%
1 ene 1980 año
26.31
+1.336
5.35%
1 ene 1981 año
28.097
+1.787
6.79%
1 ene 1982 año
30.582
+2.485
8.84%
1 ene 1983 año
34.073
+3.491
11.42%
1 ene 1984 año
37.259
+3.186
9.35%
1 ene 1985 año
39.92
+2.662
7.14%
1 ene 1986 año
41.59
+1.67
4.18%
1 ene 1987 año
42.442
+0.852
2.05%
1 ene 1988 año
41.877
-0.565
-1.33%
1 ene 1989 año
26.995
-14.882
-35.54%
1 ene 1990 año
26.082
-0.913
-3.38%
1 ene 1991 año
23.496
-2.586
-9.92%
1 ene 1992 año
23.185
-0.311
-1.32%
1 ene 1993 año
22.745
-0.44
-1.9%
1 ene 1994 año
23.069
+0.325
1.43%
1 ene 1995 año
22.766
-0.304
-1.32%
1 ene 1996 año
22.145
-0.621
-2.73%
1 ene 1997 año
21.456
-0.689
-3.11%
1 ene 1998 año
22.233
+0.776
3.62%
1 ene 1999 año
20.824
-1.409
-6.34%
1 ene 2000 año
20.733
-0.09
-0.43%
1 ene 2001 año
20.831
+0.097
0.47%
1 ene 2002 año
20.747
-0.084
-0.4%
1 ene 2003 año
19.622
-1.125
-5.42%
1 ene 2004 año
18.679
-0.943
-4.8%
1 ene 2005 año
18.308
-0.371
-1.99%
1 ene 2006 año
16.846
-1.461
-7.98%
1 ene 2007 año
16.638
-0.209
-1.24%
1 ene 2008 año
15.896
-0.742
-4.46%
1 ene 2009 año
15.386
-0.51
-3.21%
1 ene 2010 año
14.927
-0.459
-2.98%
1 ene 2011 año
14.693
-0.234
-1.57%
1 ene 2012 año
14.588
-0.104
-0.71%
1 ene 2013 año
14.604
+0.015
0.1%
1 ene 2014 año
14.662
+0.059
0.4%
Ranking de los países por los datos estadísticos actuales


Comentarios: