29
/es/
es
AIzaSyAYiBZKx7MnpbEhh9jyipgxe19OcubqV5w
April 1, 2024
116196
Cuba
CUB
true
2
1
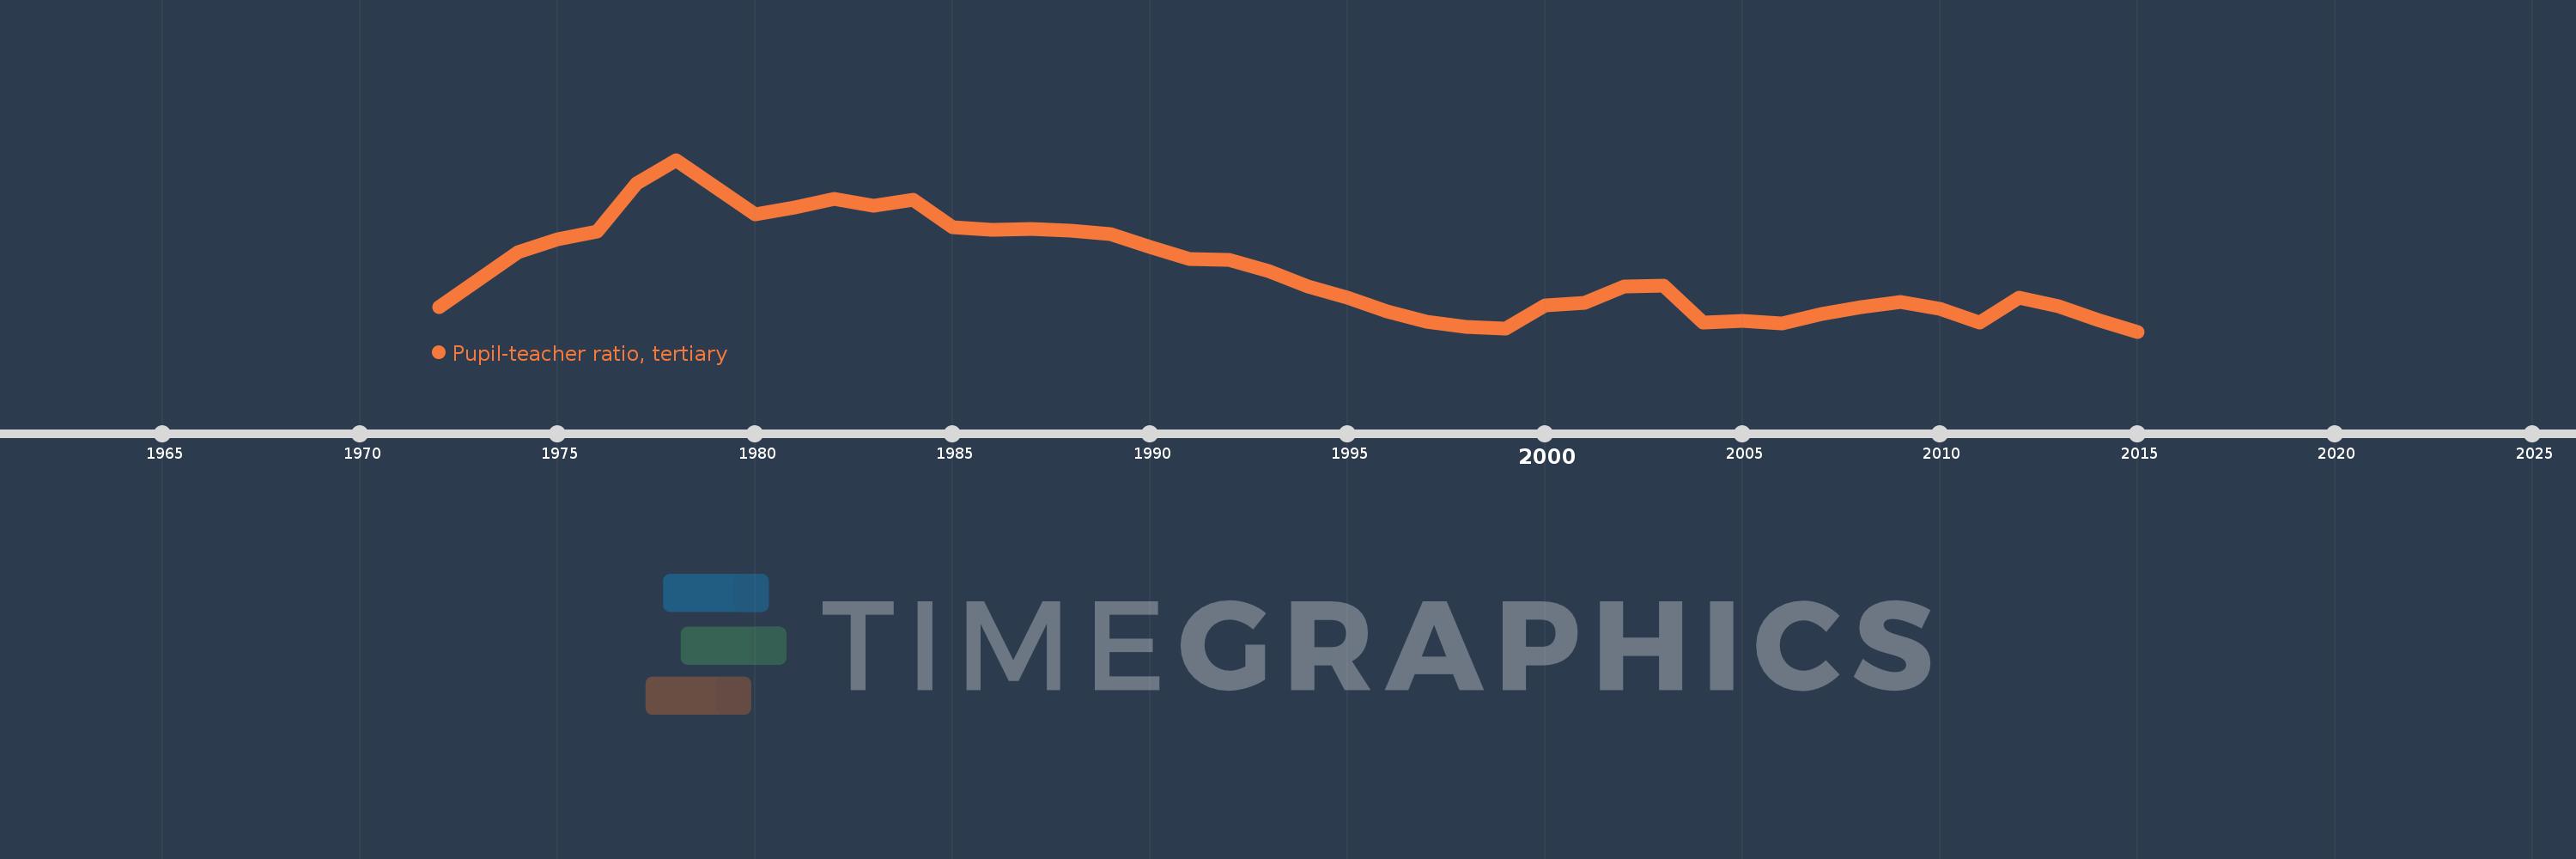
Pupil-teacher ratio, tertiary
2015,2014,2013,2012,2011,2010,2009,2008,2007,2006,2005,2004,2003,2002,2001,2000,1999,1998,1997,1996,1995,1994,1993,1992,1991,1990,1989,1988,1987,1986,1985,1984,1983,1982,1981,1980,1978,1977,1976,1975,1974,1972
Estas estadísticas en otros países:
AfghanistanAlbaniaAlgeriaAndorraAngolaAntigua and BarbudaArgentinaArmeniaArubaAustraliaAustriaAzerbaijanBahamas, TheBahrainBangladeshBarbadosBelarusBelgiumBelizeBeninBermudaBhutanBoliviaBosnia and HerzegovinaBotswanaBrazilBritish Virgin IslandsBrunei DarussalamBulgariaBurkina FasoBurundiCabo VerdeCambodiaCameroonCanadaCayman IslandsCentral African RepublicChadChileChinaColombiaComorosCongo, Dem. Rep.Congo, Rep.Costa RicaCote d'IvoireCroatiaCubaCyprusCzech RepublicDenmarkDjiboutiDominicaDominican RepublicEcuadorEgypt, Arab Rep.El SalvadorEquatorial GuineaEritreaEstoniaEthiopiaFijiFinlandFranceGabonGambia, TheGeorgiaGermanyGhanaGreeceGrenadaGuatemalaGuineaGuinea-BissauGuyanaHaitiHondurasHong Kong SAR, ChinaHungaryIcelandIndiaIndonesiaIran, Islamic Rep.IraqIrelandIsraelItalyJamaicaJapanJordanKazakhstanKorea, Dem. People’s Rep.Korea, Rep.KuwaitKyrgyz RepublicLao PDRLatviaLebanonLesothoLiberiaLibyaLiechtensteinLithuaniaLuxembourgMacao SAR, ChinaMacedonia, FYRMadagascarMalawiMalaysiaMaldivesMaliMaltaMarshall IslandsMauritaniaMauritiusMexicoMicronesia, Fed. Sts.MoldovaMongoliaMoroccoMozambiqueMyanmarNamibiaNepalNetherlandsNew ZealandNicaraguaNigerNigeriaNorwayOmanPakistanPalauPanamaPapua New GuineaParaguayPeruPhilippinesPolandPortugalPuerto RicoQatarRomaniaRussian FederationRwandaSamoaSao Tome and PrincipeSaudi ArabiaSenegalSerbiaSeychellesSierra LeoneSingaporeSint Maarten (Dutch part)Slovak RepublicSloveniaSomaliaSouth AfricaSpainSri LankaSt. Kitts and NevisSt. LuciaSt. Vincent and the GrenadinesSudanSurinameSwazilandSwedenSwitzerlandSyrian Arab RepublicTajikistanTanzaniaThailandTimor-LesteTogoTongaTrinidad and TobagoTunisiaTurkeyTurkmenistanUgandaUkraineUnited Arab EmiratesUnited KingdomUnited StatesUruguayUzbekistanVanuatuVenezuela, RBVietnamWest Bank and GazaYemen, Rep.ZambiaZimbabwe línea de tiempo (timeline):
En esta escala de tiempo se presenta un gráfico de 1972 y 2015 de Cuba. Los datos de 1971 están ausentes. El número de observaciones reales por fecha: 42.
Fuente (nombre):
Indicadores del desarrollo mundial
Fuente (organización):
United Nations Educational, Scientific, and Cultural Organization (UNESCO) Institute for Statistics.
Categorías:
Education
Se ha actualizado:
23 abr 2017 año
Los indicadores de los cambios de valor en los últimos años
Mínimo:
4.599
1 ene 2015 año
Máximo:
17.061
1 ene 1978 año
A la fecha de observación
Valor
Cambio absoluto
El cambio con respecto al valor anterior
1 ene 1972 año
6.38
+6.38
0.0%
1 ene 1974 año
10.376
+3.996
62.64%
1 ene 1975 año
11.29
+0.914
8.81%
1 ene 1976 año
11.887
+0.596
5.28%
1 ene 1977 año
15.37
+3.483
29.3%
1 ene 1978 año
17.061
+1.691
11.0%
1 ene 1980 año
13.119
-3.941
-23.1%
1 ene 1981 año
13.621
+0.502
3.83%
1 ene 1982 año
14.207
+0.586
4.3%
1 ene 1983 año
13.714
-0.494
-3.47%
1 ene 1984 año
14.188
+0.474
3.46%
1 ene 1985 año
12.14
-2.047
-14.43%
1 ene 1986 año
11.975
-0.166
-1.36%
1 ene 1987 año
12.031
+0.056
0.47%
1 ene 1988 año
11.895
-0.135
-1.12%
1 ene 1989 año
11.659
-0.237
-1.99%
1 ene 1990 año
10.726
-0.933
-8.0%
1 ene 1991 año
9.893
-0.833
-7.77%
1 ene 1992 año
9.828
-0.065
-0.66%
1 ene 1993 año
9.013
-0.815
-8.29%
1 ene 1994 año
7.856
-1.157
-12.84%
1 ene 1995 año
7.077
-0.779
-9.91%
1 ene 1996 año
6.033
-1.044
-14.75%
1 ene 1997 año
5.327
-0.706
-11.7%
1 ene 1998 año
4.943
-0.384
-7.21%
1 ene 1999 año
4.843
-0.1
-2.02%
1 ene 2000 año
6.524
+1.68
34.7%
1 ene 2001 año
6.694
+0.17
2.61%
1 ene 2002 año
7.847
+1.153
17.23%
1 ene 2003 año
7.904
+0.057
0.73%
1 ene 2004 año
5.283
-2.62
-33.16%
1 ene 2005 año
5.369
+0.086
1.62%
1 ene 2006 año
5.18
-0.189
-3.51%
1 ene 2007 año
5.896
+0.715
13.81%
1 ene 2008 año
6.369
+0.473
8.02%
1 ene 2009 año
6.721
+0.353
5.54%
1 ene 2010 año
6.272
-0.449
-6.69%
1 ene 2011 año
5.241
-1.03
-16.43%
1 ene 2012 año
7.073
+1.832
34.95%
1 ene 2013 año
6.428
-0.645
-9.12%
1 ene 2014 año
5.41
-1.018
-15.83%
1 ene 2015 año
4.599
-0.811
-15.0%
Ranking de los países por los datos estadísticos actuales


Comentarios: