29
/es/
es
AIzaSyAYiBZKx7MnpbEhh9jyipgxe19OcubqV5w
April 1, 2024
156670
Indonesia
IDN
true
2
1
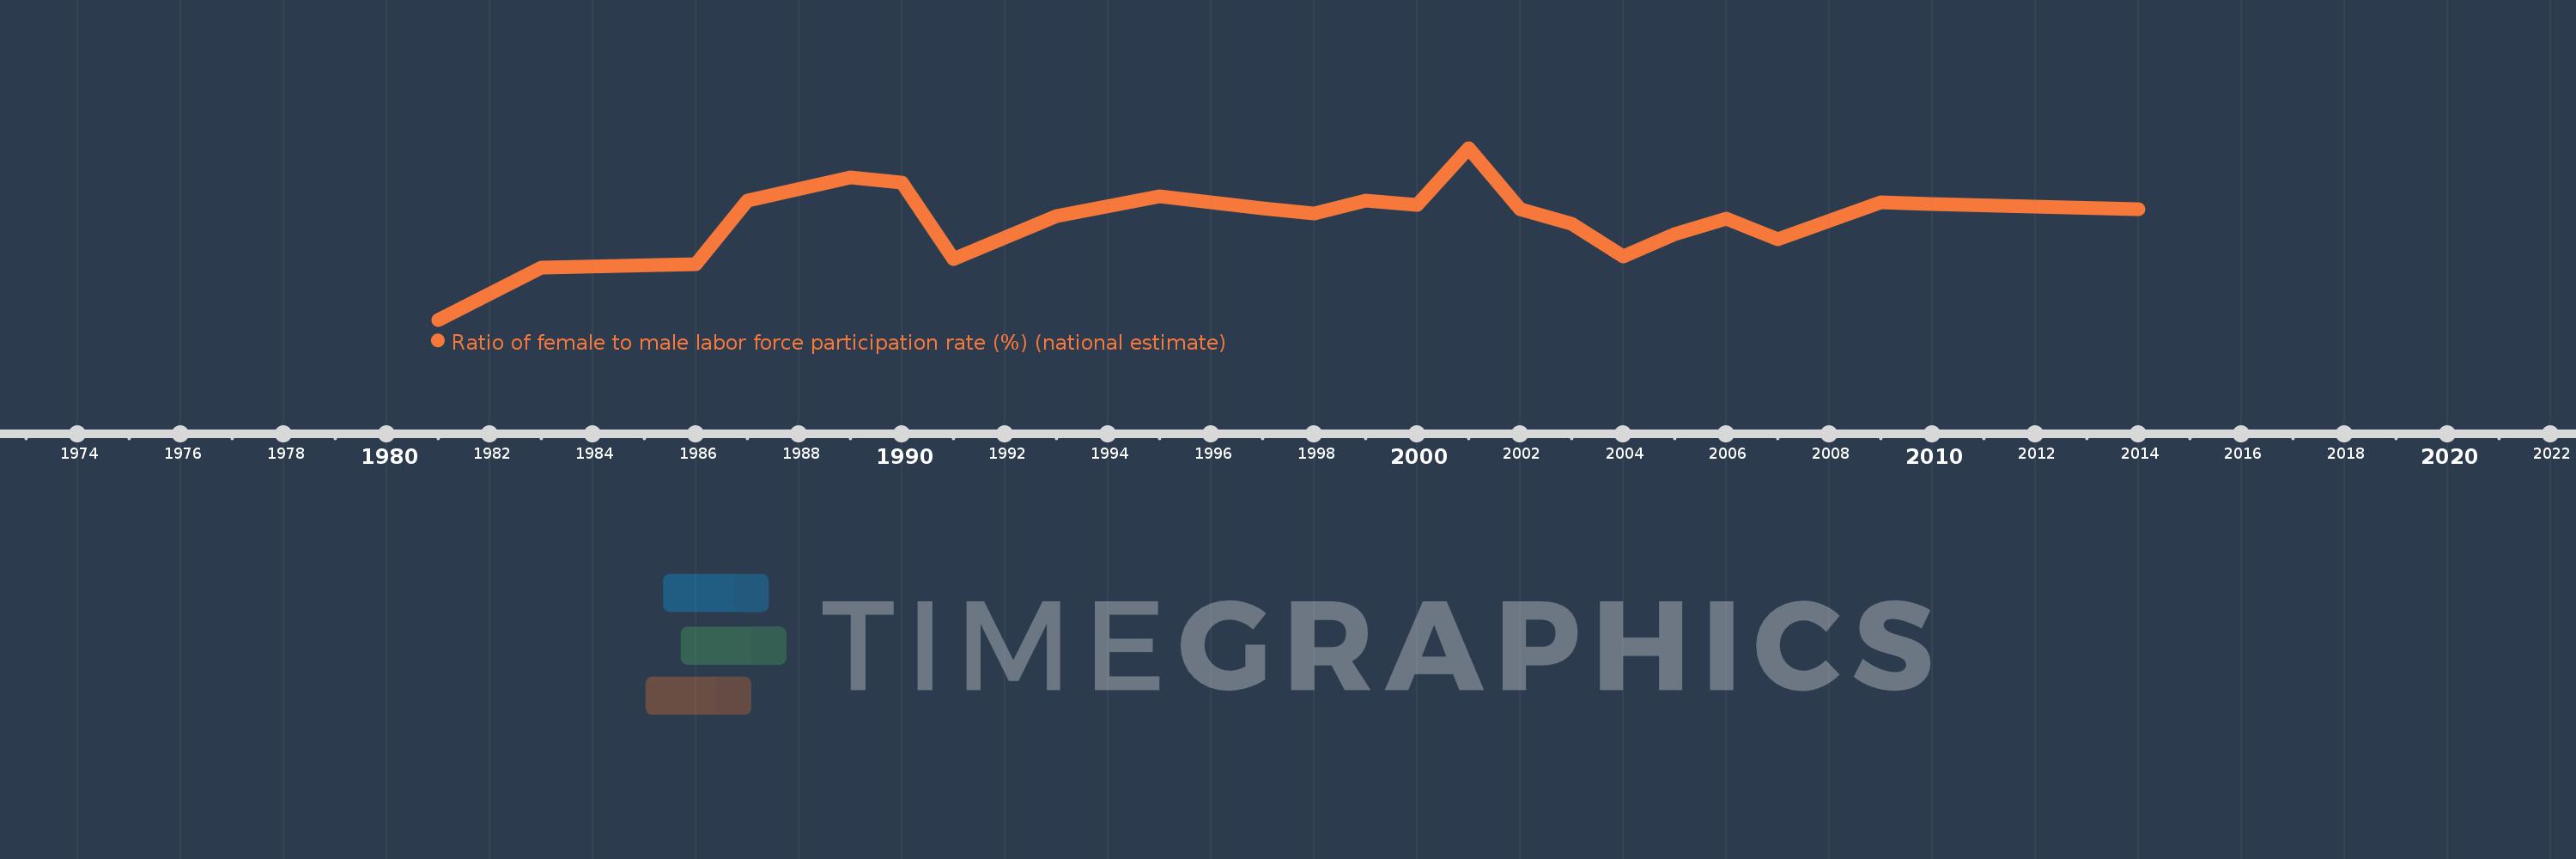
Ratio of female to male labor force participation rate (%) (national estimate)
2014,2010,2009,2007,2006,2005,2004,2003,2002,2001,2000,1999,1998,1997,1995,1993,1991,1990,1989,1987,1986,1983,1981
Estas estadísticas en otros países:
AfghanistanAlbaniaAlgeriaAmerican SamoaAntigua and BarbudaArab WorldArgentinaArmeniaArubaAustraliaAustriaAzerbaijanBahamas, TheBahrainBangladeshBarbadosBelarusBelgiumBelizeBeninBermudaBhutanBoliviaBosnia and HerzegovinaBotswanaBrazilBritish Virgin IslandsBrunei DarussalamBulgariaBurkina FasoBurundiCabo VerdeCambodiaCameroonCanadaCaribbean small statesCayman IslandsCentral African RepublicCentral Europe and the BalticsChadChileColombiaComorosCongo, Dem. Rep.Congo, Rep.Costa RicaCote d'IvoireCroatiaCubaCyprusCzech RepublicDenmarkDjiboutiDominicaDominican RepublicEarly-demographic dividendEcuadorEgypt, Arab Rep.El SalvadorEquatorial GuineaEstoniaEthiopiaEuro areaEurope & Central AsiaEurope & Central Asia (excluding high income)Europe & Central Asia (IDA & IBRD countries)European UnionFaroe IslandsFijiFinlandFranceFrench PolynesiaGabonGambia, TheGeorgiaGermanyGhanaGibraltarGreeceGrenadaGuamGuatemalaGuineaGuyanaHaitiHigh incomeHondurasHong Kong SAR, ChinaHungaryIBRD onlyIcelandIDA blendIndiaIndonesiaIran, Islamic Rep.IraqIrelandIsle of ManIsraelItalyJamaicaJapanJordanKazakhstanKenyaKiribatiKorea, Rep.KosovoKuwaitKyrgyz RepublicLao PDRLatin America & Caribbean Latin America & Caribbean (excluding high income)Latin America & the Caribbean (IDA & IBRD countries)LatviaLebanonLesothoLiberiaLibyaLiechtensteinLithuaniaLower middle incomeLuxembourgMacao SAR, ChinaMacedonia, FYRMadagascarMalawiMalaysiaMaldivesMaliMaltaMarshall IslandsMauritaniaMauritiusMexicoMiddle East & North AfricaMiddle East & North Africa (excluding high income)Middle East & North Africa (IDA & IBRD countries)MoldovaMonacoMongoliaMontenegroMoroccoMozambiqueMyanmarNamibiaNauruNepalNetherlandsNew CaledoniaNew ZealandNicaraguaNigerNigeriaNorth AmericaNorthern Mariana IslandsNorwayOECD membersOmanPakistanPalauPanamaPapua New GuineaParaguayPeruPhilippinesPolandPortugalPost-demographic dividendPuerto RicoQatarRomaniaRussian FederationRwandaSamoaSan MarinoSao Tome and PrincipeSaudi ArabiaSenegalSerbiaSeychellesSierra LeoneSingaporeSlovak RepublicSloveniaSolomon IslandsSouth AfricaSouth AsiaSouth Asia (IDA & IBRD)South SudanSpainSri LankaSt. Kitts and NevisSt. LuciaSt. Vincent and the GrenadinesSudanSurinameSwazilandSwedenSwitzerlandSyrian Arab RepublicTajikistanTanzaniaThailandTimor-LesteTogoTongaTrinidad and TobagoTunisiaTurkeyTurks and Caicos IslandsTuvaluUgandaUkraineUnited Arab EmiratesUnited KingdomUnited StatesUruguayVanuatuVenezuela, RBVietnamVirgin Islands (U.S.)West Bank and GazaYemen, Rep.ZambiaZimbabwe línea de tiempo (timeline):
En esta escala de tiempo se presenta un gráfico de 1981 y 2014 de Indonesia. Los datos de 1980 están ausentes. El número de observaciones reales por fecha: 23.
Fuente (nombre):
Indicadores del desarrollo mundial
Fuente (organización):
International Labour Organization, Key Indicators of the Labour Market database.
Categorías:
Social Protection & Labor
Se ha actualizado:
23 abr 2017 año
Los indicadores de los cambios de valor en los últimos años
Mínimo:
46.144
1 ene 1981 año
Máximo:
68.237
1 ene 2001 año
A la fecha de observación
Valor
Cambio absoluto
El cambio con respecto al valor anterior
1 ene 1981 año
46.144
+46.144
0.0%
1 ene 1983 año
52.808
+6.663
14.44%
1 ene 1986 año
53.244
+0.436
0.83%
1 ene 1987 año
61.473
+8.23
15.46%
1 ene 1989 año
64.425
+2.952
4.8%
1 ene 1990 año
63.827
-0.598
-0.93%
1 ene 1991 año
53.93
-9.897
-15.51%
1 ene 1993 año
59.443
+5.513
10.22%
1 ene 1995 año
62.073
+2.63
4.42%
1 ene 1997 año
60.495
-1.578
-2.54%
1 ene 1998 año
59.832
-0.663
-1.1%
1 ene 1999 año
61.453
+1.621
2.71%
1 ene 2000 año
60.875
-0.579
-0.94%
1 ene 2001 año
68.237
+7.362
12.09%
1 ene 2002 año
60.373
-7.864
-11.52%
1 ene 2003 año
58.528
-1.845
-3.06%
1 ene 2004 año
54.279
-4.249
-7.26%
1 ene 2005 año
57.209
+2.93
5.4%
1 ene 2006 año
59.112
+1.903
3.33%
1 ene 2007 año
56.532
-2.58
-4.37%
1 ene 2009 año
61.198
+4.666
8.25%
1 ene 2010 año
61.005
-0.193
-0.32%
1 ene 2014 año
60.312
-0.693
-1.14%
Ranking de los países por los datos estadísticos actuales


Comentarios: