29
/es/
es
AIzaSyAYiBZKx7MnpbEhh9jyipgxe19OcubqV5w
April 1, 2024
105404
Chile
CHL
true
2
1
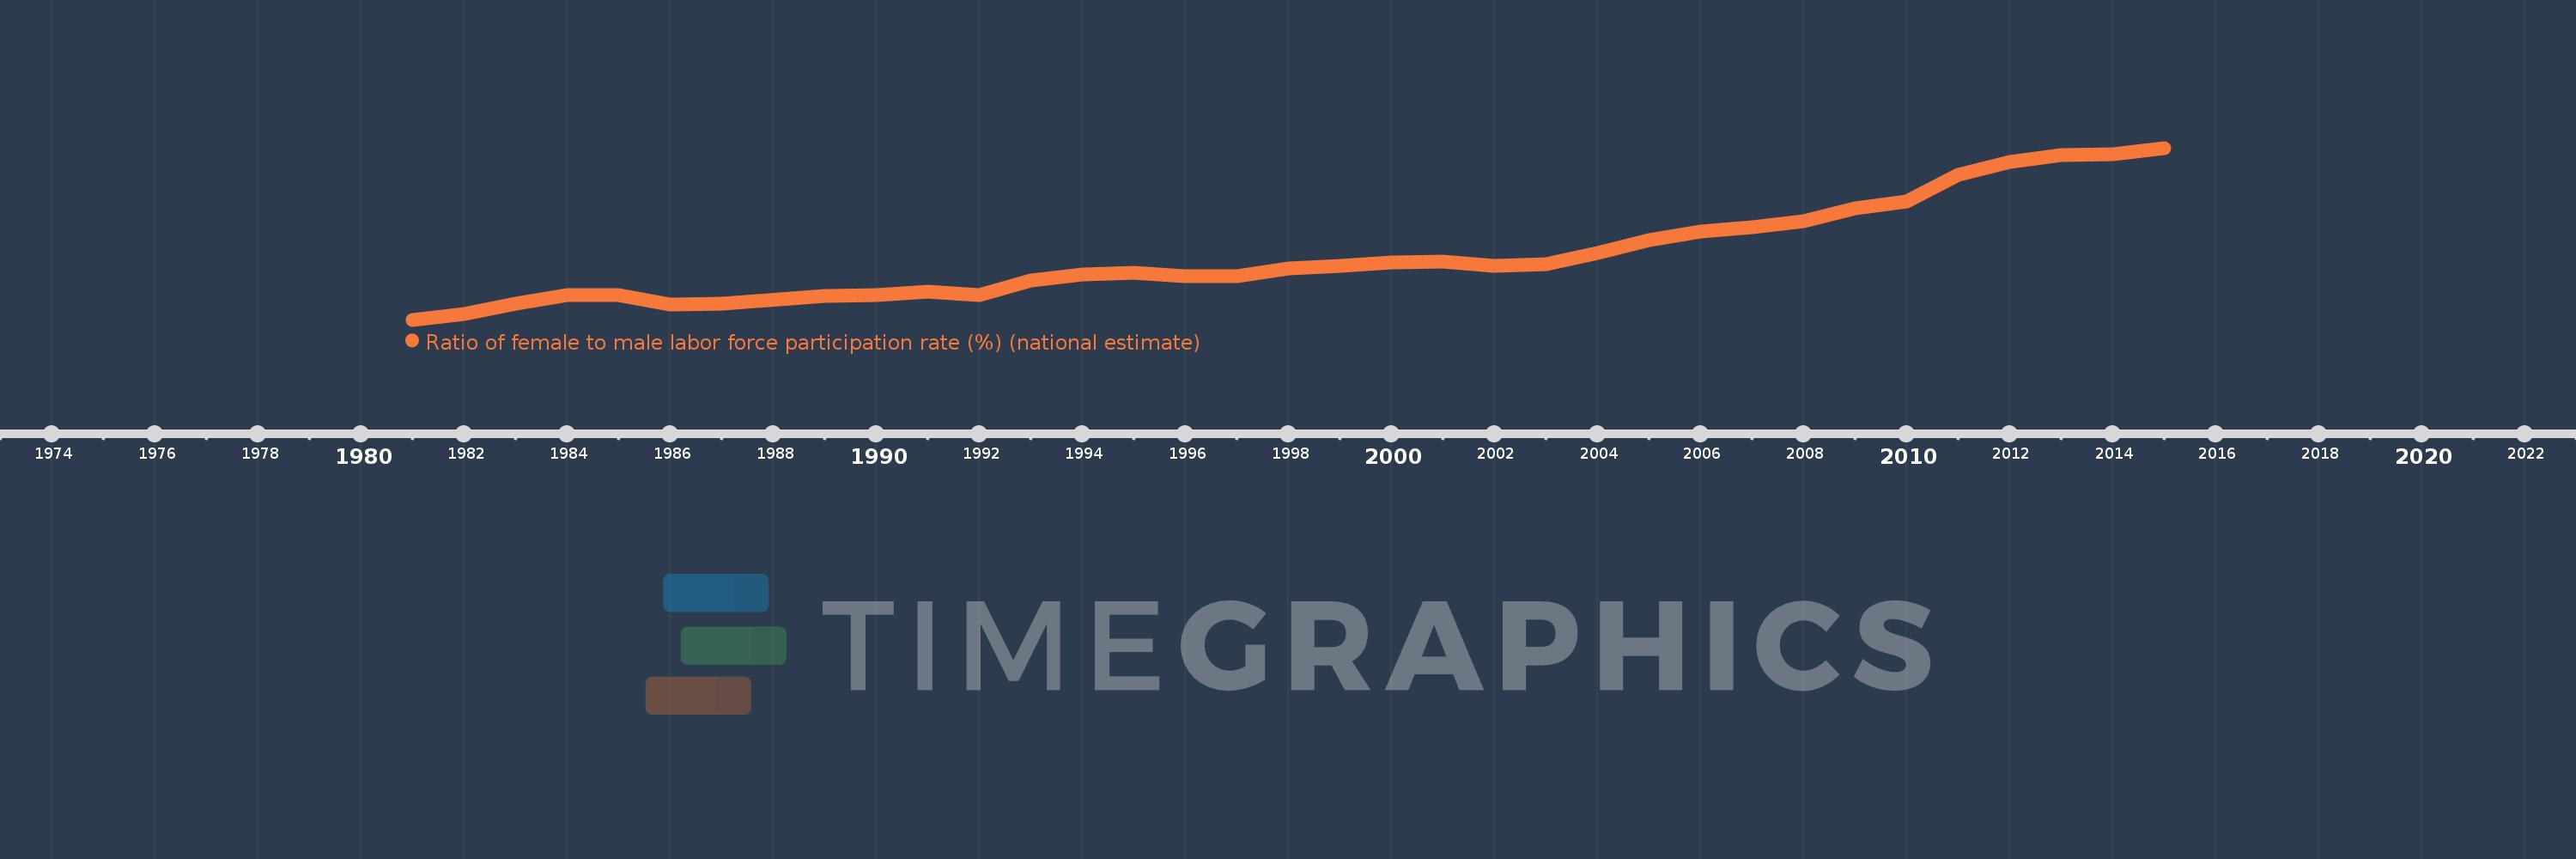
Ratio of female to male labor force participation rate (%) (national estimate)
2015,2014,2013,2012,2011,2010,2009,2008,2007,2006,2005,2004,2003,2002,2001,2000,1999,1998,1997,1996,1995,1994,1993,1992,1991,1990,1989,1987,1986,1985,1984,1983,1982,1981
Estas estadísticas en otros países:
AfghanistanAlbaniaAlgeriaAmerican SamoaAntigua and BarbudaArab WorldArgentinaArmeniaArubaAustraliaAustriaAzerbaijanBahamas, TheBahrainBangladeshBarbadosBelarusBelgiumBelizeBeninBermudaBhutanBoliviaBosnia and HerzegovinaBotswanaBrazilBritish Virgin IslandsBrunei DarussalamBulgariaBurkina FasoBurundiCabo VerdeCambodiaCameroonCanadaCaribbean small statesCayman IslandsCentral African RepublicCentral Europe and the BalticsChadChileColombiaComorosCongo, Dem. Rep.Congo, Rep.Costa RicaCote d'IvoireCroatiaCubaCyprusCzech RepublicDenmarkDjiboutiDominicaDominican RepublicEarly-demographic dividendEcuadorEgypt, Arab Rep.El SalvadorEquatorial GuineaEstoniaEthiopiaEuro areaEurope & Central AsiaEurope & Central Asia (excluding high income)Europe & Central Asia (IDA & IBRD countries)European UnionFaroe IslandsFijiFinlandFranceFrench PolynesiaGabonGambia, TheGeorgiaGermanyGhanaGibraltarGreeceGrenadaGuamGuatemalaGuineaGuyanaHaitiHigh incomeHondurasHong Kong SAR, ChinaHungaryIBRD onlyIcelandIDA blendIndiaIndonesiaIran, Islamic Rep.IraqIrelandIsle of ManIsraelItalyJamaicaJapanJordanKazakhstanKenyaKiribatiKorea, Rep.KosovoKuwaitKyrgyz RepublicLao PDRLatin America & Caribbean Latin America & Caribbean (excluding high income)Latin America & the Caribbean (IDA & IBRD countries)LatviaLebanonLesothoLiberiaLibyaLiechtensteinLithuaniaLower middle incomeLuxembourgMacao SAR, ChinaMacedonia, FYRMadagascarMalawiMalaysiaMaldivesMaliMaltaMarshall IslandsMauritaniaMauritiusMexicoMiddle East & North AfricaMiddle East & North Africa (excluding high income)Middle East & North Africa (IDA & IBRD countries)MoldovaMonacoMongoliaMontenegroMoroccoMozambiqueMyanmarNamibiaNauruNepalNetherlandsNew CaledoniaNew ZealandNicaraguaNigerNigeriaNorth AmericaNorthern Mariana IslandsNorwayOECD membersOmanPakistanPalauPanamaPapua New GuineaParaguayPeruPhilippinesPolandPortugalPost-demographic dividendPuerto RicoQatarRomaniaRussian FederationRwandaSamoaSan MarinoSao Tome and PrincipeSaudi ArabiaSenegalSerbiaSeychellesSierra LeoneSingaporeSlovak RepublicSloveniaSolomon IslandsSouth AfricaSouth AsiaSouth Asia (IDA & IBRD)South SudanSpainSri LankaSt. Kitts and NevisSt. LuciaSt. Vincent and the GrenadinesSudanSurinameSwazilandSwedenSwitzerlandSyrian Arab RepublicTajikistanTanzaniaThailandTimor-LesteTogoTongaTrinidad and TobagoTunisiaTurkeyTurks and Caicos IslandsTuvaluUgandaUkraineUnited Arab EmiratesUnited KingdomUnited StatesUruguayVanuatuVenezuela, RBVietnamVirgin Islands (U.S.)West Bank and GazaYemen, Rep.ZambiaZimbabwe línea de tiempo (timeline):
En esta escala de tiempo se presenta un gráfico de 1981 y 2015 de Chile. Los datos de 1980 están ausentes. El número de observaciones reales por fecha: 34.
Fuente (nombre):
Indicadores del desarrollo mundial
Fuente (organización):
International Labour Organization, Key Indicators of the Labour Market database.
Categorías:
Social Protection & Labor
Se ha actualizado:
23 abr 2017 año
Los indicadores de los cambios de valor en los últimos años
Mínimo:
37.358
1 ene 1981 año
Máximo:
67.598
1 ene 2015 año
A la fecha de observación
Valor
Cambio absoluto
El cambio con respecto al valor anterior
1 ene 1981 año
37.358
+37.358
0.0%
1 ene 1982 año
38.34
+0.983
2.63%
1 ene 1983 año
40.117
+1.777
4.63%
1 ene 1984 año
41.765
+1.648
4.11%
1 ene 1985 año
41.655
-0.11
-0.26%
1 ene 1986 año
40.108
-1.547
-3.71%
1 ene 1987 año
40.217
+0.11
0.27%
1 ene 1989 año
41.489
+1.272
3.16%
1 ene 1990 año
41.689
+0.199
0.48%
1 ene 1991 año
42.344
+0.655
1.57%
1 ene 1992 año
41.622
-0.721
-1.7%
1 ene 1993 año
44.238
+2.616
6.29%
1 ene 1994 año
45.325
+1.086
2.46%
1 ene 1995 año
45.692
+0.367
0.81%
1 ene 1996 año
45.08
-0.612
-1.34%
1 ene 1997 año
44.96
-0.12
-0.27%
1 ene 1998 año
46.319
+1.358
3.02%
1 ene 1999 año
46.854
+0.535
1.16%
1 ene 2000 año
47.51
+0.656
1.4%
1 ene 2001 año
47.613
+0.102
0.22%
1 ene 2002 año
46.897
-0.716
-1.5%
1 ene 2003 año
47.075
+0.179
0.38%
1 ene 2004 año
49.091
+2.016
4.28%
1 ene 2005 año
51.344
+2.253
4.59%
1 ene 2006 año
52.841
+1.497
2.92%
1 ene 2007 año
53.641
+0.801
1.52%
1 ene 2008 año
54.762
+1.12
2.09%
1 ene 2009 año
56.964
+2.202
4.02%
1 ene 2010 año
58.169
+1.205
2.12%
1 ene 2011 año
62.829
+4.66
8.01%
1 ene 2012 año
65.199
+2.37
3.77%
1 ene 2013 año
66.297
+1.097
1.68%
1 ene 2014 año
66.435
+0.138
0.21%
1 ene 2015 año
67.598
+1.163
1.75%
Ranking de los países por los datos estadísticos actuales


Comentarios: