29
/es/
es
AIzaSyAYiBZKx7MnpbEhh9jyipgxe19OcubqV5w
April 1, 2024
134541
France
FRA
true
2
1
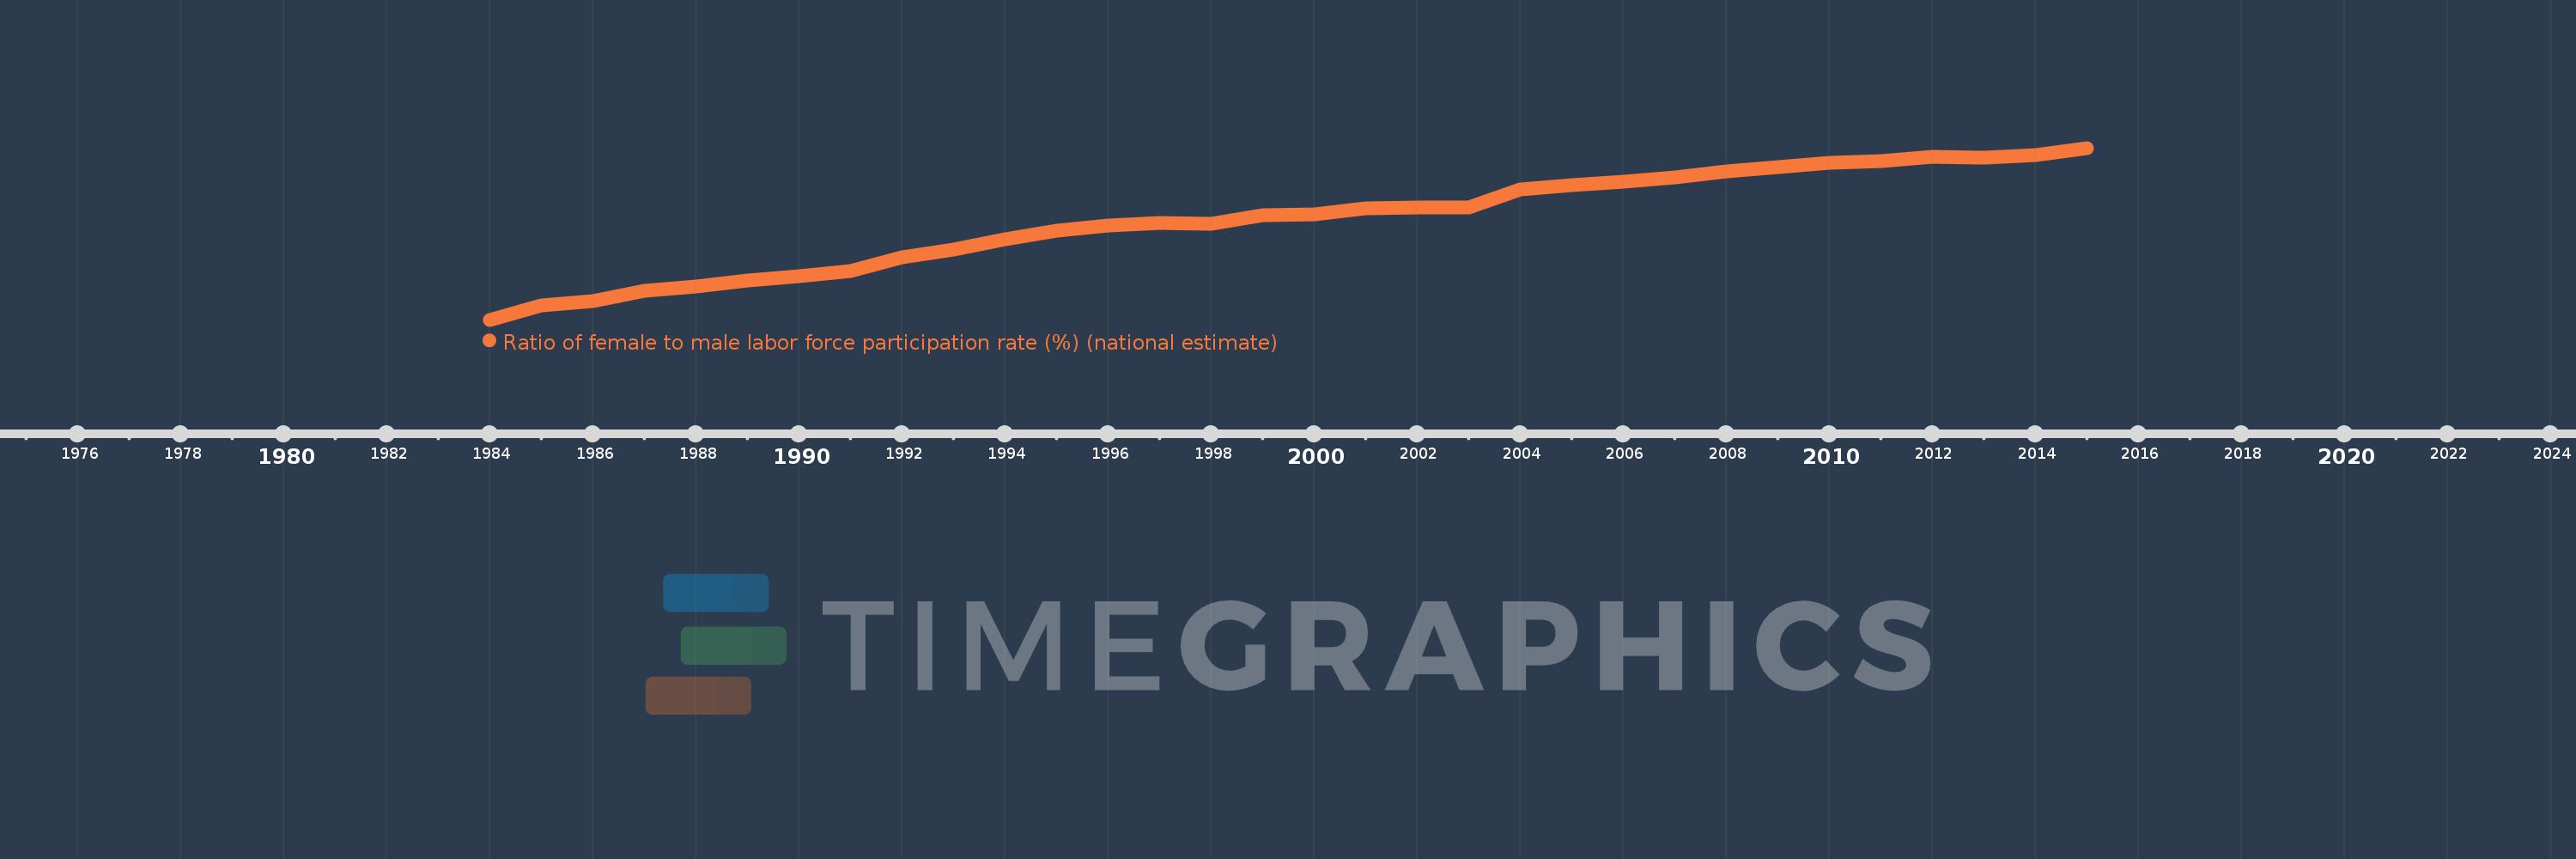
Ratio of female to male labor force participation rate (%) (national estimate)
2015,2014,2013,2012,2011,2010,2009,2008,2007,2006,2005,2004,2003,2002,2001,2000,1999,1998,1997,1996,1995,1994,1993,1992,1991,1990,1989,1988,1987,1986,1985,1984
Estas estadísticas en otros países:
AfghanistanAlbaniaAlgeriaAmerican SamoaAntigua and BarbudaArab WorldArgentinaArmeniaArubaAustraliaAustriaAzerbaijanBahamas, TheBahrainBangladeshBarbadosBelarusBelgiumBelizeBeninBermudaBhutanBoliviaBosnia and HerzegovinaBotswanaBrazilBritish Virgin IslandsBrunei DarussalamBulgariaBurkina FasoBurundiCabo VerdeCambodiaCameroonCanadaCaribbean small statesCayman IslandsCentral African RepublicCentral Europe and the BalticsChadChileColombiaComorosCongo, Dem. Rep.Congo, Rep.Costa RicaCote d'IvoireCroatiaCubaCyprusCzech RepublicDenmarkDjiboutiDominicaDominican RepublicEarly-demographic dividendEcuadorEgypt, Arab Rep.El SalvadorEquatorial GuineaEstoniaEthiopiaEuro areaEurope & Central AsiaEurope & Central Asia (excluding high income)Europe & Central Asia (IDA & IBRD countries)European UnionFaroe IslandsFijiFinlandFranceFrench PolynesiaGabonGambia, TheGeorgiaGermanyGhanaGibraltarGreeceGrenadaGuamGuatemalaGuineaGuyanaHaitiHigh incomeHondurasHong Kong SAR, ChinaHungaryIBRD onlyIcelandIDA blendIndiaIndonesiaIran, Islamic Rep.IraqIrelandIsle of ManIsraelItalyJamaicaJapanJordanKazakhstanKenyaKiribatiKorea, Rep.KosovoKuwaitKyrgyz RepublicLao PDRLatin America & Caribbean Latin America & Caribbean (excluding high income)Latin America & the Caribbean (IDA & IBRD countries)LatviaLebanonLesothoLiberiaLibyaLiechtensteinLithuaniaLower middle incomeLuxembourgMacao SAR, ChinaMacedonia, FYRMadagascarMalawiMalaysiaMaldivesMaliMaltaMarshall IslandsMauritaniaMauritiusMexicoMiddle East & North AfricaMiddle East & North Africa (excluding high income)Middle East & North Africa (IDA & IBRD countries)MoldovaMonacoMongoliaMontenegroMoroccoMozambiqueMyanmarNamibiaNauruNepalNetherlandsNew CaledoniaNew ZealandNicaraguaNigerNigeriaNorth AmericaNorthern Mariana IslandsNorwayOECD membersOmanPakistanPalauPanamaPapua New GuineaParaguayPeruPhilippinesPolandPortugalPost-demographic dividendPuerto RicoQatarRomaniaRussian FederationRwandaSamoaSan MarinoSao Tome and PrincipeSaudi ArabiaSenegalSerbiaSeychellesSierra LeoneSingaporeSlovak RepublicSloveniaSolomon IslandsSouth AfricaSouth AsiaSouth Asia (IDA & IBRD)South SudanSpainSri LankaSt. Kitts and NevisSt. LuciaSt. Vincent and the GrenadinesSudanSurinameSwazilandSwedenSwitzerlandSyrian Arab RepublicTajikistanTanzaniaThailandTimor-LesteTogoTongaTrinidad and TobagoTunisiaTurkeyTurks and Caicos IslandsTuvaluUgandaUkraineUnited Arab EmiratesUnited KingdomUnited StatesUruguayVanuatuVenezuela, RBVietnamVirgin Islands (U.S.)West Bank and GazaYemen, Rep.ZambiaZimbabwe línea de tiempo (timeline):
En esta escala de tiempo se presenta un gráfico de 1984 y 2015 de France. Los datos de 1983 están ausentes. El número de observaciones reales por fecha: 32.
Fuente (nombre):
Indicadores del desarrollo mundial
Fuente (organización):
International Labour Organization, Key Indicators of the Labour Market database.
Categorías:
Social Protection & Labor
Se ha actualizado:
23 abr 2017 año
Los indicadores de los cambios de valor en los últimos años
Mínimo:
65.292
1 ene 1984 año
Máximo:
84.779
1 ene 2015 año
A la fecha de observación
Valor
Cambio absoluto
El cambio con respecto al valor anterior
1 ene 1984 año
65.292
+65.292
0.0%
1 ene 1985 año
66.955
+1.664
2.55%
1 ene 1986 año
67.391
+0.436
0.65%
1 ene 1987 año
68.559
+1.168
1.73%
1 ene 1988 año
69.072
+0.513
0.75%
1 ene 1989 año
69.701
+0.629
0.91%
1 ene 1990 año
70.27
+0.569
0.82%
1 ene 1991 año
70.865
+0.595
0.85%
1 ene 1992 año
72.377
+1.512
2.13%
1 ene 1993 año
73.22
+0.843
1.17%
1 ene 1994 año
74.415
+1.195
1.63%
1 ene 1995 año
75.353
+0.938
1.26%
1 ene 1996 año
76.025
+0.672
0.89%
1 ene 1997 año
76.295
+0.27
0.36%
1 ene 1998 año
76.145
-0.15
-0.2%
1 ene 1999 año
77.143
+0.998
1.31%
1 ene 2000 año
77.251
+0.108
0.14%
1 ene 2001 año
77.937
+0.685
0.89%
1 ene 2002 año
77.99
+0.054
0.07%
1 ene 2003 año
78.06
+0.07
0.09%
1 ene 2004 año
80.032
+1.971
2.53%
1 ene 2005 año
80.604
+0.572
0.72%
1 ene 2006 año
80.99
+0.386
0.48%
1 ene 2007 año
81.41
+0.42
0.52%
1 ene 2008 año
82.154
+0.744
0.91%
1 ene 2009 año
82.609
+0.454
0.55%
1 ene 2010 año
83.119
+0.51
0.62%
1 ene 2011 año
83.253
+0.134
0.16%
1 ene 2012 año
83.793
+0.54
0.65%
1 ene 2013 año
83.683
-0.109
-0.13%
1 ene 2014 año
83.955
+0.271
0.32%
1 ene 2015 año
84.779
+0.824
0.98%
Ranking de los países por los datos estadísticos actuales


Comentarios: