29
/es/
es
AIzaSyAYiBZKx7MnpbEhh9jyipgxe19OcubqV5w
April 1, 2024
110766
Congo, Rep.
COG
true
2
1
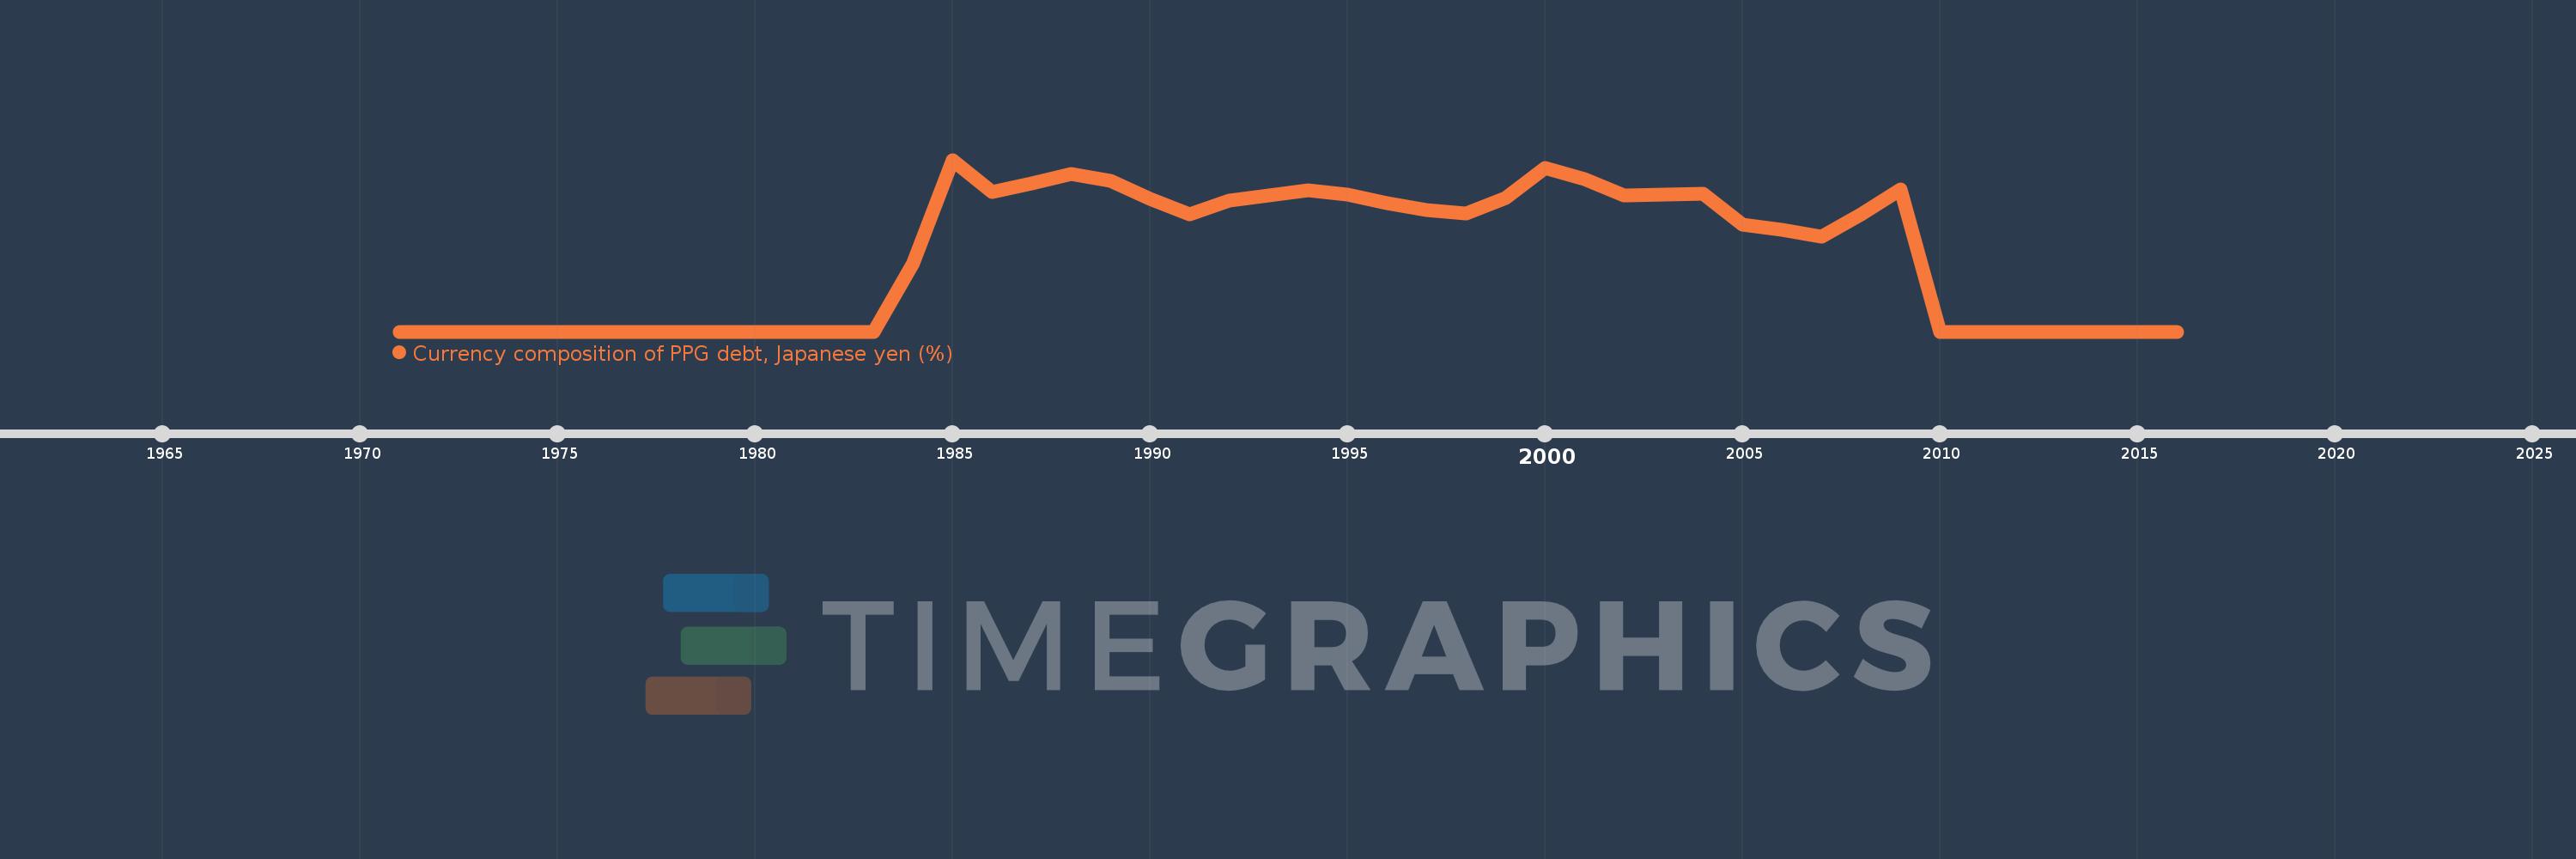
Currency composition of PPG debt, Japanese yen (%)
2016,2015,2014,2013,2012,2011,2010,2009,2008,2007,2006,2005,2004,2003,2002,2001,2000,1999,1998,1997,1996,1995,1994,1993,1992,1991,1990,1989,1988,1987,1986,1985,1984,1983,1982,1981,1980,1979,1978,1977,1976,1975,1974,1973,1972,1971
Estas estadísticas en otros países:
línea de tiempo (timeline):
En esta escala de tiempo se presenta un gráfico de 1971 y 2016 de Congo, Rep.. Los datos de 1970 están ausentes. El número de observaciones reales por fecha: 46.
Fuente (nombre):
Indicadores del desarrollo mundial
Fuente (organización):
World Bank, International Debt Statistics.
Categorías:
External Debt
Se ha actualizado:
23 abr 2017 año
Los indicadores de los cambios de valor en los últimos años
Máximo:
0.248
1 ene 1985 año
A la fecha de observación
Valor
Cambio absoluto
El cambio con respecto al valor anterior
1 ene 1971 año
0.0
0.0
0.0%
1 ene 1984 año
0.099
+0.099
%
1 ene 1985 año
0.248
+0.149
150.2%
1 ene 1986 año
0.201
-0.048
-19.14%
1 ene 1987 año
0.214
+0.013
6.53%
1 ene 1988 año
0.228
+0.014
6.5%
1 ene 1989 año
0.218
-0.01
-4.35%
1 ene 1990 año
0.191
-0.027
-12.53%
1 ene 1991 año
0.169
-0.022
-11.5%
1 ene 1992 año
0.189
+0.02
11.86%
1 ene 1993 año
0.197
+0.009
4.56%
1 ene 1994 año
0.204
+0.007
3.55%
1 ene 1995 año
0.198
-0.006
-3.09%
1 ene 1996 año
0.185
-0.013
-6.72%
1 ene 1997 año
0.175
-0.01
-5.36%
1 ene 1998 año
0.171
-0.004
-2.4%
1 ene 1999 año
0.193
+0.022
13.2%
1 ene 2000 año
0.236
+0.043
22.28%
1 ene 2001 año
0.22
-0.016
-6.95%
1 ene 2002 año
0.197
-0.023
-10.43%
1 ene 2003 año
0.198
+0.001
0.46%
1 ene 2004 año
0.199
+0.001
0.51%
1 ene 2005 año
0.155
-0.043
-21.7%
1 ene 2006 año
0.147
-0.009
-5.66%
1 ene 2007 año
0.137
-0.01
-6.82%
1 ene 2008 año
0.169
+0.033
23.92%
1 ene 2009 año
0.205
+0.036
21.31%
1 ene 2010 año
0.0
-0.205
-100.0%
Ranking de los países por los datos estadísticos actuales


Comentarios: