29
/es/
es
AIzaSyAYiBZKx7MnpbEhh9jyipgxe19OcubqV5w
April 1, 2024
285711
Zambia
ZMB
true
2
1
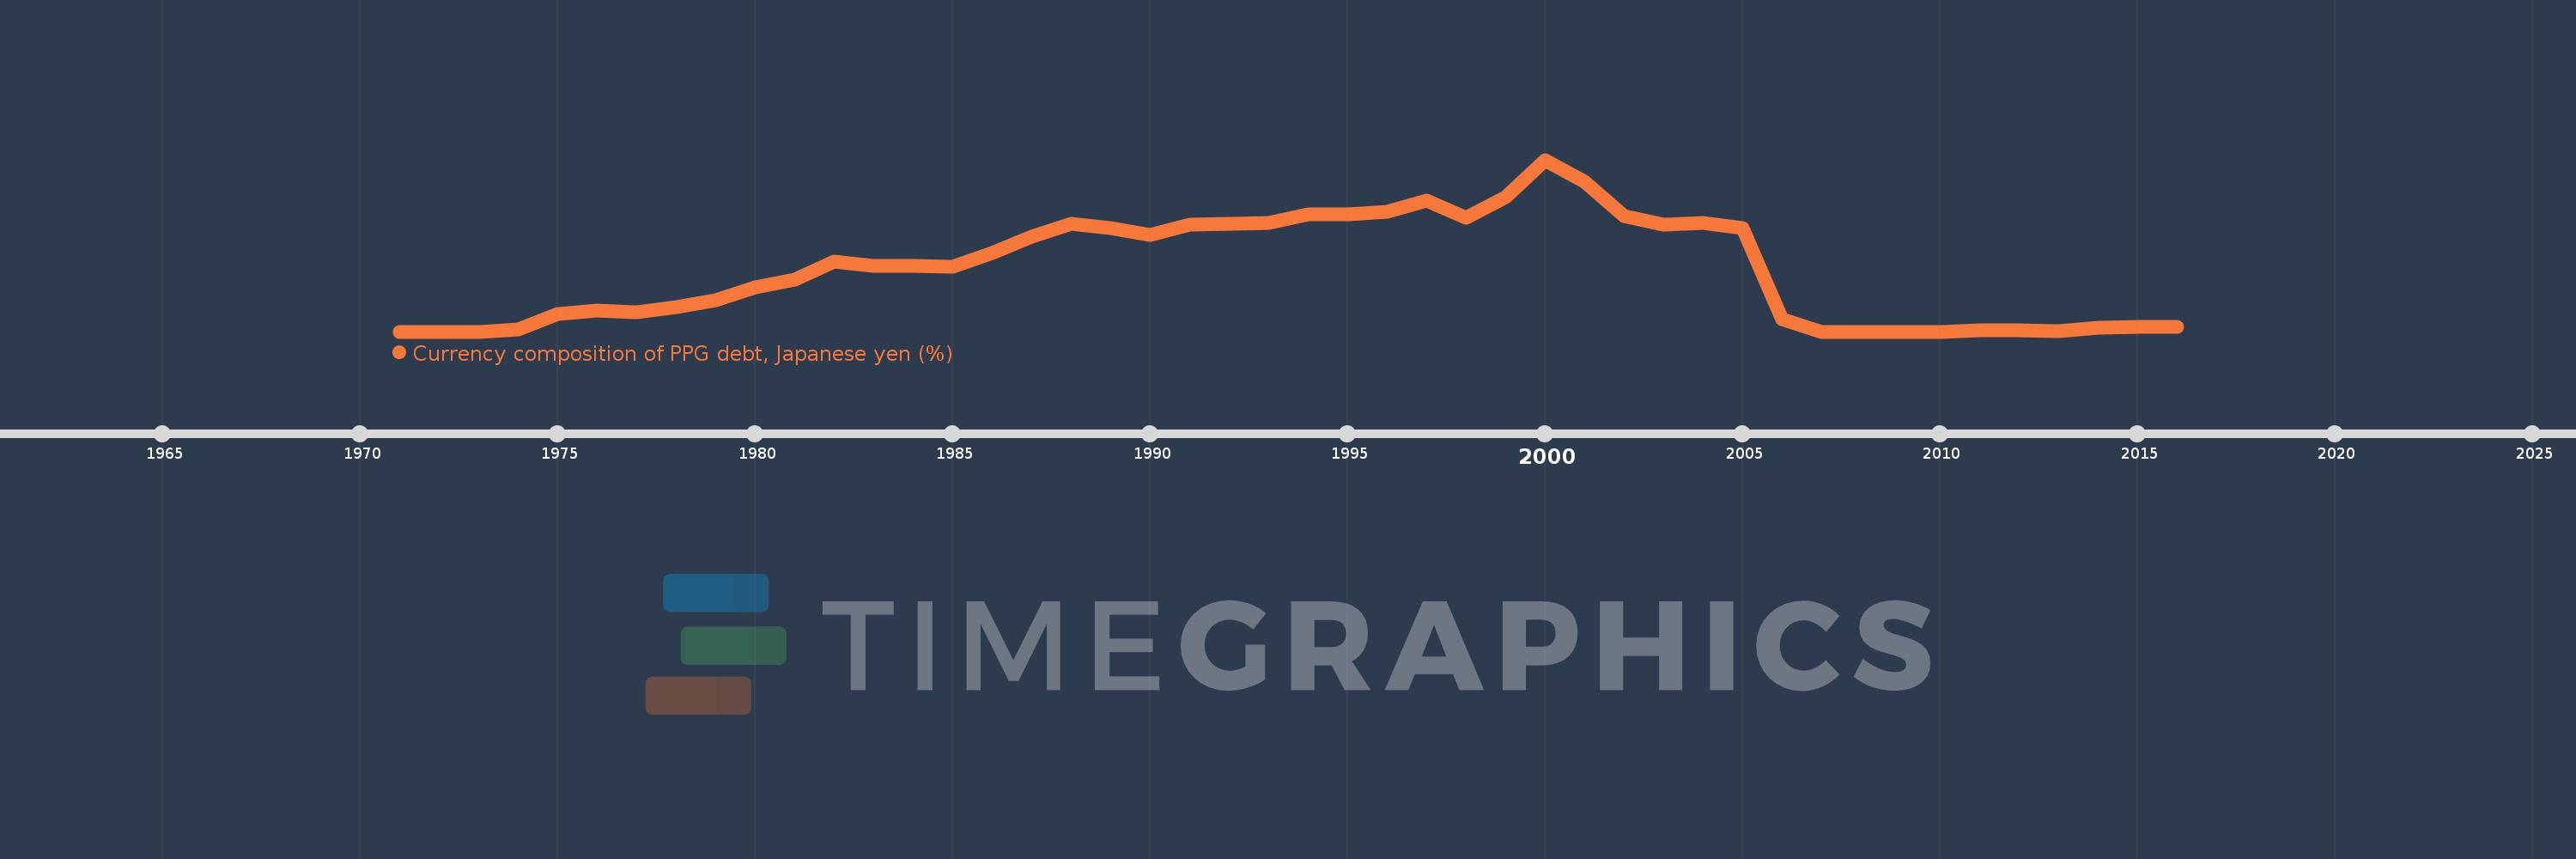
Currency composition of PPG debt, Japanese yen (%)
2016,2015,2014,2013,2012,2011,2010,2009,2008,2007,2006,2005,2004,2003,2002,2001,2000,1999,1998,1997,1996,1995,1994,1993,1992,1991,1990,1989,1988,1987,1986,1985,1984,1983,1982,1981,1980,1979,1978,1977,1976,1975,1974,1973,1972,1971
Estas estadísticas en otros países:
línea de tiempo (timeline):
En esta escala de tiempo se presenta un gráfico de 1971 y 2016 de Zambia. Los datos de 1970 están ausentes. El número de observaciones reales por fecha: 46.
Fuente (nombre):
Indicadores del desarrollo mundial
Fuente (organización):
World Bank, International Debt Statistics.
Categorías:
External Debt
Se ha actualizado:
23 abr 2017 año
Los indicadores de los cambios de valor en los últimos años
Máximo:
16.016
1 ene 2000 año
A la fecha de observación
Valor
Cambio absoluto
El cambio con respecto al valor anterior
1 ene 1971 año
0.0
0.0
0.0%
1 ene 1974 año
0.217
+0.217
%
1 ene 1975 año
1.63
+1.412
649.59%
1 ene 1976 año
1.989
+0.36
22.08%
1 ene 1977 año
1.778
-0.212
-10.64%
1 ene 1978 año
2.245
+0.468
26.3%
1 ene 1979 año
2.95
+0.704
31.38%
1 ene 1980 año
4.162
+1.212
41.08%
1 ene 1981 año
4.824
+0.662
15.92%
1 ene 1982 año
6.511
+1.687
34.96%
1 ene 1983 año
6.09
-0.421
-6.46%
1 ene 1984 año
6.136
+0.046
0.76%
1 ene 1985 año
6.054
-0.081
-1.33%
1 ene 1986 año
7.298
+1.243
20.53%
1 ene 1987 año
8.849
+1.551
21.25%
1 ene 1988 año
10.045
+1.196
13.52%
1 ene 1989 año
9.621
-0.423
-4.21%
1 ene 1990 año
9.02
-0.601
-6.25%
1 ene 1991 año
9.988
+0.968
10.74%
1 ene 1992 año
10.069
+0.081
0.81%
1 ene 1993 año
10.116
+0.047
0.47%
1 ene 1994 año
10.913
+0.797
7.88%
1 ene 1995 año
10.891
-0.023
-0.21%
1 ene 1996 año
11.2
+0.309
2.84%
1 ene 1997 año
12.246
+1.046
9.34%
1 ene 1998 año
10.629
-1.617
-13.2%
1 ene 1999 año
12.505
+1.876
17.65%
1 ene 2000 año
16.016
+3.511
28.08%
1 ene 2001 año
13.935
-2.082
-13.0%
1 ene 2002 año
10.807
-3.127
-22.44%
1 ene 2003 año
9.996
-0.812
-7.51%
1 ene 2004 año
10.13
+0.134
1.34%
1 ene 2005 año
9.676
-0.454
-4.48%
1 ene 2006 año
1.188
-8.489
-87.73%
1 ene 2007 año
0.0
-1.188
-100.0%
1 ene 2011 año
0.12
+0.12
%
1 ene 2012 año
0.092
-0.028
-23.04%
1 ene 2013 año
0.05
-0.042
-45.44%
1 ene 2014 año
0.374
+0.323
642.74%
1 ene 2015 año
0.418
+0.044
11.86%
1 ene 2016 año
0.463
+0.045
10.7%
Ranking de los países por los datos estadísticos actuales


Comentarios: