29
/de/
de
AIzaSyAYiBZKx7MnpbEhh9jyipgxe19OcubqV5w
April 1, 2024
89575
Botswana
BWA
true
2
1
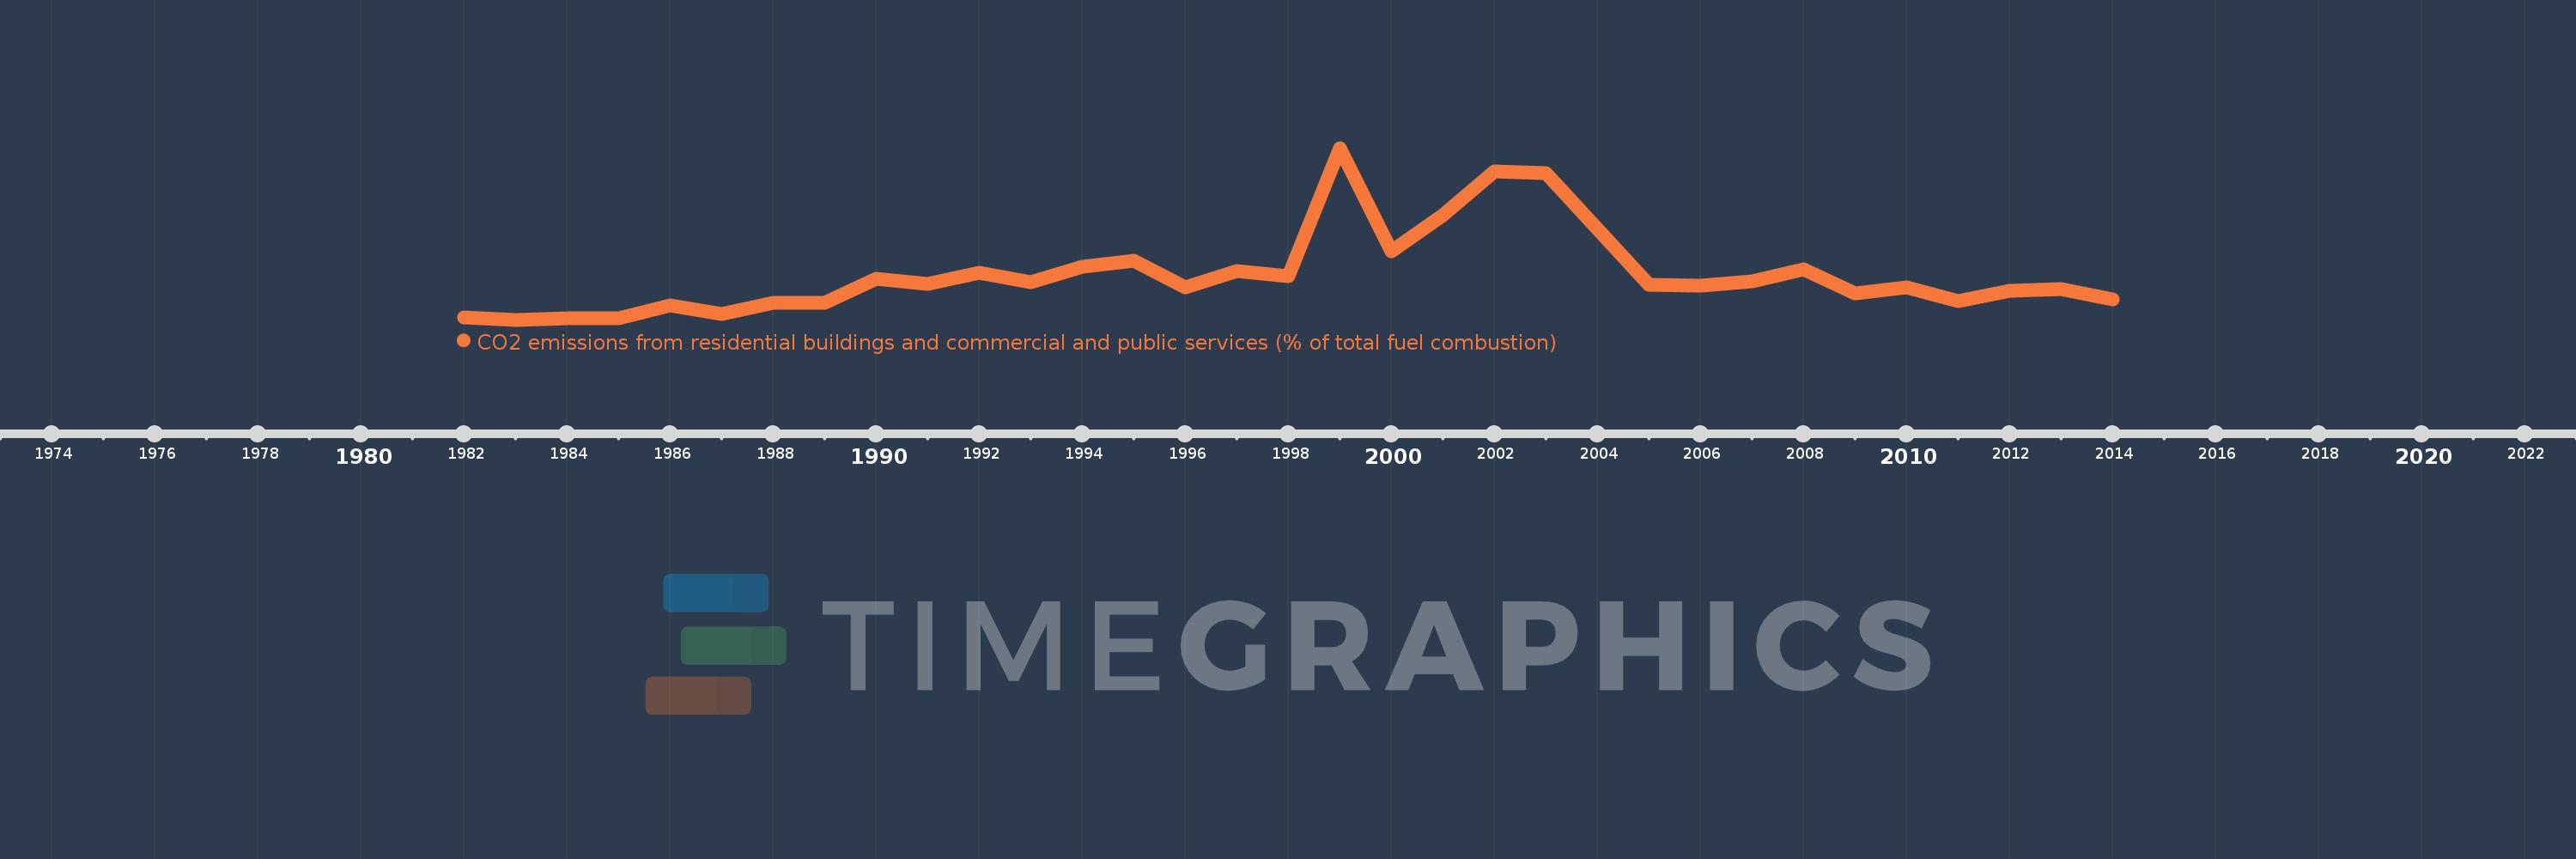
CO2 emissions from residential buildings and commercial and public services (% of total fuel combustion)
2014,2013,2012,2011,2010,2009,2008,2007,2006,2005,2004,2003,2002,2001,2000,1999,1998,1997,1996,1995,1994,1993,1992,1991,1990,1989,1988,1987,1986,1985,1984,1983,1982
Diese Statistik in anderen Ländern:
AlbaniaAlgeriaAngolaArab WorldArgentinaArmeniaAustraliaAustriaAzerbaijanBahrainBangladeshBelarusBelgiumBeninBoliviaBosnia and HerzegovinaBotswanaBrazilBrunei DarussalamBulgariaCambodiaCameroonCanadaCaribbean small statesCentral Europe and the BalticsChileChinaColombiaCongo, Dem. Rep.Congo, Rep.Costa RicaCote d'IvoireCroatiaCubaCuracaoCyprusCzech RepublicDenmarkDominican RepublicEarly-demographic dividendEast Asia & PacificEast Asia & Pacific (excluding high income)East Asia & Pacific (IDA & IBRD countries)EcuadorEgypt, Arab Rep.El SalvadorEritreaEstoniaEthiopiaEuro areaEurope & Central AsiaEurope & Central Asia (excluding high income)Europe & Central Asia (IDA & IBRD countries)European UnionFinlandFragile and conflict affected situationsFranceGabonGeorgiaGermanyGhanaGibraltarGreeceGuatemalaHaitiHeavily indebted poor countries (HIPC)High incomeHondurasHong Kong SAR, ChinaHungaryIBRD onlyIcelandIDA & IBRD totalIDA blendIDA onlyIDA totalIndiaIndonesiaIran, Islamic Rep.IraqIrelandIsraelItalyJamaicaJapanJordanKazakhstanKenyaKorea, Dem. People’s Rep.Korea, Rep.KosovoKuwaitKyrgyz RepublicLate-demographic dividendLatin America & Caribbean Latin America & Caribbean (excluding high income)Latin America & the Caribbean (IDA & IBRD countries)LatviaLeast developed countries: UN classificationLebanonLibyaLithuaniaLow & middle incomeLow incomeLower middle incomeLuxembourgMacedonia, FYRMalaysiaMaltaMauritiusMexicoMiddle East & North AfricaMiddle East & North Africa (excluding high income)Middle East & North Africa (IDA & IBRD countries)Middle incomeMoldovaMongoliaMontenegroMoroccoMozambiqueMyanmarNamibiaNepalNetherlandsNew ZealandNicaraguaNigerNigeriaNorth AmericaNorwayOECD membersOmanOther small statesPakistanPanamaParaguayPeruPhilippinesPolandPortugalPost-demographic dividendPre-demographic dividendQatarRomaniaRussian FederationSaudi ArabiaSenegalSerbiaSingaporeSlovak RepublicSloveniaSmall statesSouth AfricaSouth AsiaSouth Asia (IDA & IBRD)South SudanSpainSri LankaSub-Saharan Africa Sub-Saharan Africa (excluding high income)Sub-Saharan Africa (IDA & IBRD countries)SudanSwedenSwitzerlandSyrian Arab RepublicTajikistanTanzaniaThailandTogoTrinidad and TobagoTunisiaTurkeyTurkmenistanUkraineUnited Arab EmiratesUnited KingdomUnited StatesUpper middle incomeUruguayUzbekistanVenezuela, RBVietnamWorldYemen, Rep.ZambiaZimbabwe Zeitlinie:
Diese Zeitleiste vorliegt die Graphik ab 1982 J. bis 2014 J. Botswana. Die Angaben bis 1981 J. sind nicht vorhanden. Die Zahl aktueller Beobachtungen nach Daten: 33.
Die Quelle (Bezeichnung):
Kennzahlen der Weltentwicklung
Die Quelle (Einrichtung):
IEA Statistics © OECD/IEA 2014 (http://www.iea.org/stats/index.asp), subject to https://www.iea.org/t&c/termsandconditions/
Kategorien:
Environment
Es wurde aktualisiert:
23 Apr 2017 Jahr
Kennzahlen der Wertänderungen vom Jahr zum Jahr
Minimum:
2.083
1 Jan 1983 Jahr
Maximum:
9.239
1 Jan 1999 Jahr
Zum Datum der Beobachtung
Wert
Absolute Veränderung
Die Veränderung bezüglich dem vorherigen Wert
1 Jan 1982 Jahr
2.174
+2.174
0.0%
1 Jan 1983 Jahr
2.083
-0.091
-4.17%
1 Jan 1984 Jahr
2.128
+0.044
2.13%
1 Jan 1985 Jahr
2.143
+0.015
0.71%
1 Jan 1986 Jahr
2.667
+0.524
24.44%
1 Jan 1987 Jahr
2.312
-0.355
-13.29%
1 Jan 1988 Jahr
2.793
+0.481
20.81%
1 Jan 1989 Jahr
2.791
-0.003
-0.09%
1 Jan 1990 Jahr
3.797
+1.007
36.08%
1 Jan 1991 Jahr
3.559
-0.239
-6.29%
1 Jan 1992 Jahr
4.029
+0.471
13.22%
1 Jan 1993 Jahr
3.636
-0.393
-9.75%
1 Jan 1994 Jahr
4.308
+0.671
18.46%
1 Jan 1995 Jahr
4.545
+0.238
5.52%
1 Jan 1996 Jahr
3.448
-1.097
-24.14%
1 Jan 1997 Jahr
4.11
+0.661
19.18%
1 Jan 1998 Jahr
3.909
-0.201
-4.89%
1 Jan 1999 Jahr
9.239
+5.33
136.37%
1 Jan 2000 Jahr
4.922
-4.317
-46.72%
1 Jan 2001 Jahr
6.452
+1.529
31.07%
1 Jan 2002 Jahr
8.269
+1.817
28.17%
1 Jan 2003 Jahr
8.189
-0.08
-0.97%
1 Jan 2004 Jahr
5.882
-2.306
-28.16%
1 Jan 2005 Jahr
3.526
-2.356
-40.05%
1 Jan 2006 Jahr
3.505
-0.022
-0.62%
1 Jan 2007 Jahr
3.686
+0.181
5.16%
1 Jan 2008 Jahr
4.167
+0.481
13.06%
1 Jan 2009 Jahr
3.189
-0.978
-23.46%
1 Jan 2010 Jahr
3.431
+0.242
7.6%
1 Jan 2011 Jahr
2.875
-0.557
-16.22%
1 Jan 2012 Jahr
3.282
+0.408
14.18%
1 Jan 2013 Jahr
3.363
+0.081
2.47%
1 Jan 2014 Jahr
2.92
-0.444
-13.19%
Bewertung der Länder gemäß mit laufender Statistik nach Jahren


Kommentare: