29
/de/
de
AIzaSyAYiBZKx7MnpbEhh9jyipgxe19OcubqV5w
April 1, 2024
264348
Togo
TGO
true
2
1
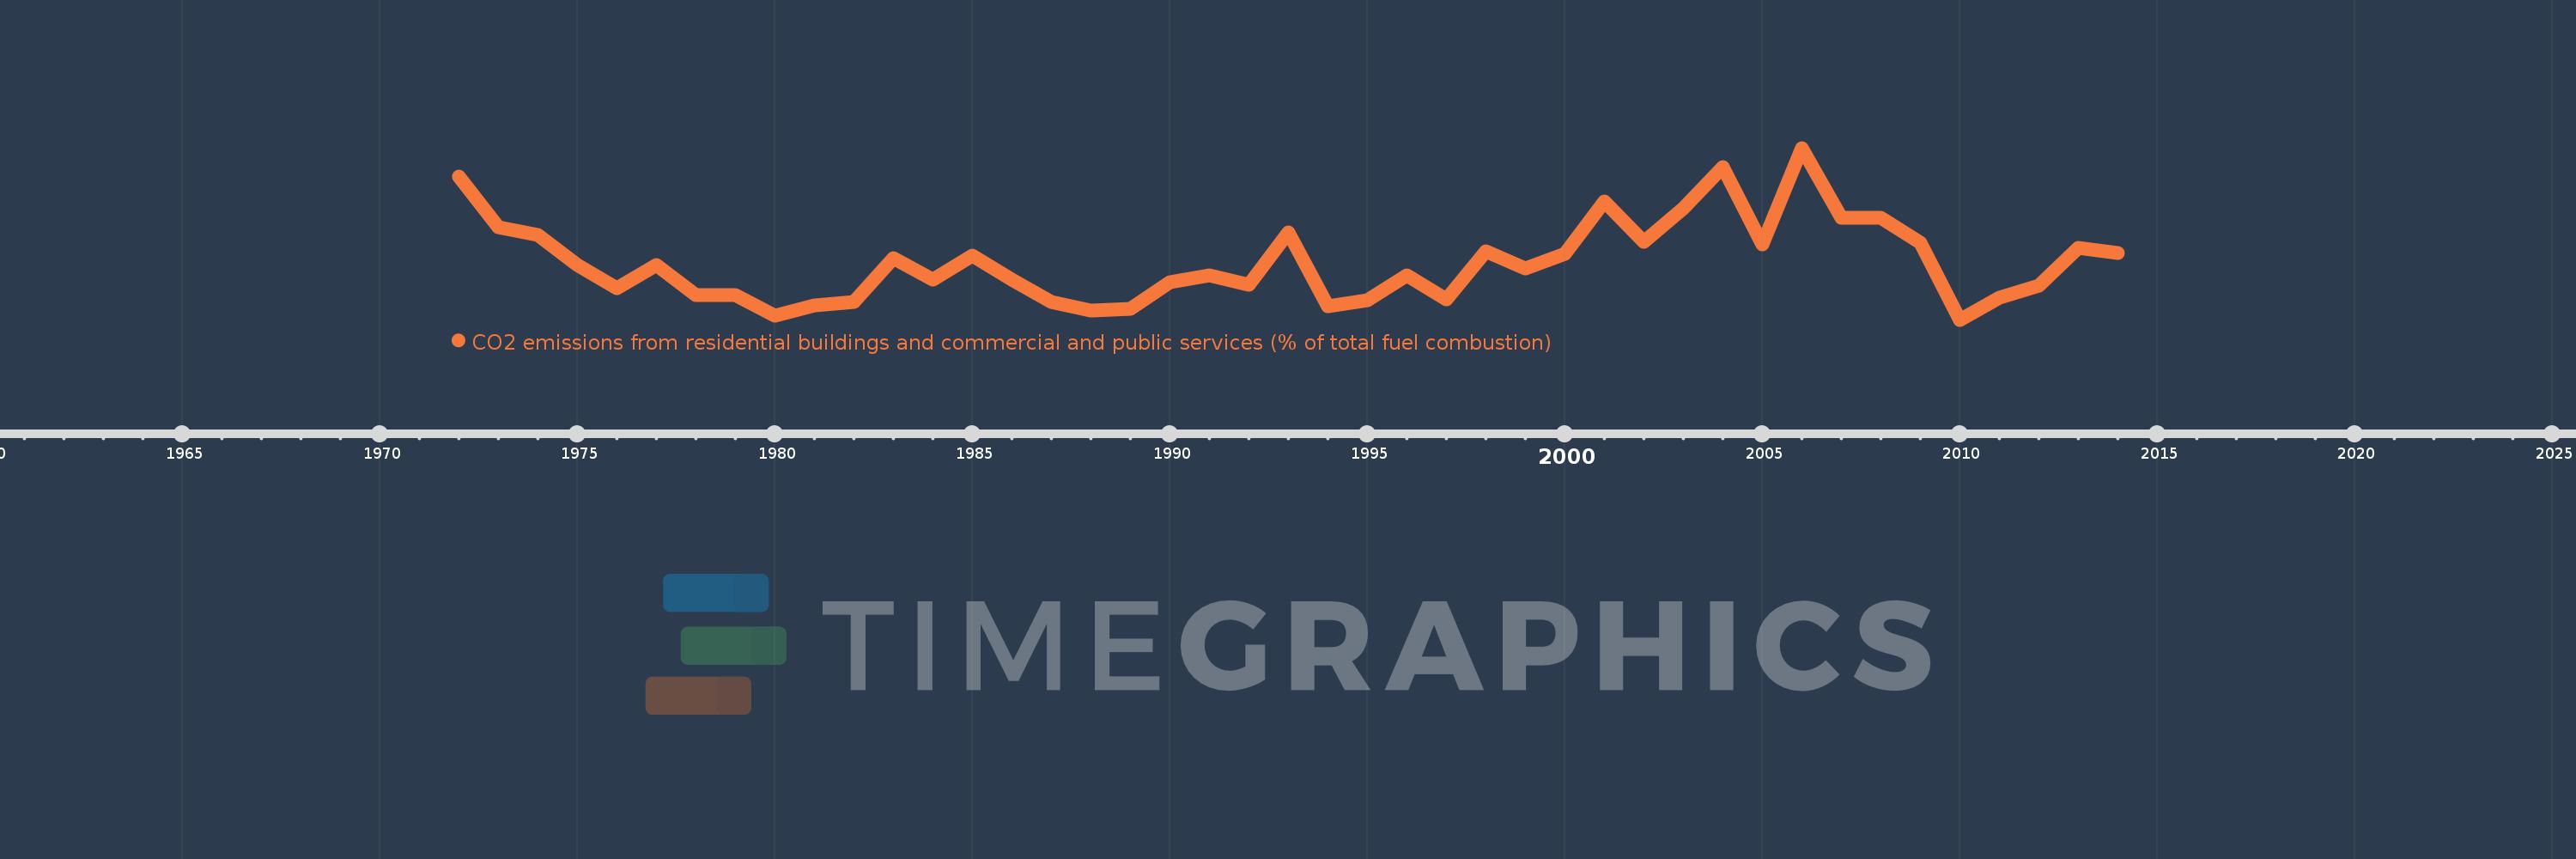
CO2 emissions from residential buildings and commercial and public services (% of total fuel combustion)
2014,2013,2012,2011,2010,2009,2008,2007,2006,2005,2004,2003,2002,2001,2000,1999,1998,1997,1996,1995,1994,1993,1992,1991,1990,1989,1988,1987,1986,1985,1984,1983,1982,1981,1980,1979,1978,1977,1976,1975,1974,1973,1972
Diese Statistik in anderen Ländern:
AlbaniaAlgeriaAngolaArab WorldArgentinaArmeniaAustraliaAustriaAzerbaijanBahrainBangladeshBelarusBelgiumBeninBoliviaBosnia and HerzegovinaBotswanaBrazilBrunei DarussalamBulgariaCambodiaCameroonCanadaCaribbean small statesCentral Europe and the BalticsChileChinaColombiaCongo, Dem. Rep.Congo, Rep.Costa RicaCote d'IvoireCroatiaCubaCuracaoCyprusCzech RepublicDenmarkDominican RepublicEarly-demographic dividendEast Asia & PacificEast Asia & Pacific (excluding high income)East Asia & Pacific (IDA & IBRD countries)EcuadorEgypt, Arab Rep.El SalvadorEritreaEstoniaEthiopiaEuro areaEurope & Central AsiaEurope & Central Asia (excluding high income)Europe & Central Asia (IDA & IBRD countries)European UnionFinlandFragile and conflict affected situationsFranceGabonGeorgiaGermanyGhanaGibraltarGreeceGuatemalaHaitiHeavily indebted poor countries (HIPC)High incomeHondurasHong Kong SAR, ChinaHungaryIBRD onlyIcelandIDA & IBRD totalIDA blendIDA onlyIDA totalIndiaIndonesiaIran, Islamic Rep.IraqIrelandIsraelItalyJamaicaJapanJordanKazakhstanKenyaKorea, Dem. People’s Rep.Korea, Rep.KosovoKuwaitKyrgyz RepublicLate-demographic dividendLatin America & Caribbean Latin America & Caribbean (excluding high income)Latin America & the Caribbean (IDA & IBRD countries)LatviaLeast developed countries: UN classificationLebanonLibyaLithuaniaLow & middle incomeLow incomeLower middle incomeLuxembourgMacedonia, FYRMalaysiaMaltaMauritiusMexicoMiddle East & North AfricaMiddle East & North Africa (excluding high income)Middle East & North Africa (IDA & IBRD countries)Middle incomeMoldovaMongoliaMontenegroMoroccoMozambiqueMyanmarNamibiaNepalNetherlandsNew ZealandNicaraguaNigerNigeriaNorth AmericaNorwayOECD membersOmanOther small statesPakistanPanamaParaguayPeruPhilippinesPolandPortugalPost-demographic dividendPre-demographic dividendQatarRomaniaRussian FederationSaudi ArabiaSenegalSerbiaSingaporeSlovak RepublicSloveniaSmall statesSouth AfricaSouth AsiaSouth Asia (IDA & IBRD)South SudanSpainSri LankaSub-Saharan Africa Sub-Saharan Africa (excluding high income)Sub-Saharan Africa (IDA & IBRD countries)SudanSwedenSwitzerlandSyrian Arab RepublicTajikistanTanzaniaThailandTogoTrinidad and TobagoTunisiaTurkeyTurkmenistanUkraineUnited Arab EmiratesUnited KingdomUnited StatesUpper middle incomeUruguayUzbekistanVenezuela, RBVietnamWorldYemen, Rep.ZambiaZimbabwe Zeitlinie:
Diese Zeitleiste vorliegt die Graphik ab 1972 J. bis 2014 J. Togo. Die Angaben bis 1971 J. sind nicht vorhanden. Die Zahl aktueller Beobachtungen nach Daten: 43.
Die Quelle (Bezeichnung):
Kennzahlen der Weltentwicklung
Die Quelle (Einrichtung):
IEA Statistics © OECD/IEA 2014 (http://www.iea.org/stats/index.asp), subject to https://www.iea.org/t&c/termsandconditions/
Kategorien:
Environment
Es wurde aktualisiert:
23 Apr 2017 Jahr
Kennzahlen der Wertänderungen vom Jahr zum Jahr
Minimum:
7.018
1 Jan 2010 Jahr
Maximum:
19.792
1 Jan 2006 Jahr
Zum Datum der Beobachtung
Wert
Absolute Veränderung
Die Veränderung bezüglich dem vorherigen Wert
1 Jan 1972 Jahr
17.647
+17.647
0.0%
1 Jan 1973 Jahr
13.889
-3.758
-21.3%
1 Jan 1974 Jahr
13.333
-0.556
-4.0%
1 Jan 1975 Jahr
11.111
-2.222
-16.67%
1 Jan 1976 Jahr
9.375
-1.736
-15.62%
1 Jan 1977 Jahr
11.111
+1.736
18.52%
1 Jan 1978 Jahr
8.824
-2.288
-20.59%
1 Jan 1979 Jahr
8.824
0.0
0.0%
1 Jan 1980 Jahr
7.317
-1.506
-17.07%
1 Jan 1981 Jahr
8.108
+0.791
10.81%
1 Jan 1982 Jahr
8.333
+0.225
2.78%
1 Jan 1983 Jahr
11.628
+3.295
39.53%
1 Jan 1984 Jahr
10.0
-1.628
-14.0%
1 Jan 1985 Jahr
11.765
+1.765
17.65%
1 Jan 1986 Jahr
10.0
-1.765
-15.0%
1 Jan 1987 Jahr
8.333
-1.667
-16.67%
1 Jan 1988 Jahr
7.692
-0.641
-7.69%
1 Jan 1989 Jahr
7.843
+0.151
1.96%
1 Jan 1990 Jahr
9.804
+1.961
25.0%
1 Jan 1991 Jahr
10.345
+0.541
5.52%
1 Jan 1992 Jahr
9.615
-0.729
-7.05%
1 Jan 1993 Jahr
13.514
+3.898
40.54%
1 Jan 1994 Jahr
8.0
-5.514
-40.8%
1 Jan 1995 Jahr
8.475
+0.475
5.93%
1 Jan 1996 Jahr
10.345
+1.87
22.07%
1 Jan 1997 Jahr
8.511
-1.834
-17.73%
1 Jan 1998 Jahr
12.121
+3.611
42.42%
1 Jan 1999 Jahr
10.843
-1.278
-10.54%
1 Jan 2000 Jahr
11.927
+1.083
9.99%
1 Jan 2001 Jahr
15.789
+3.863
32.39%
1 Jan 2002 Jahr
12.821
-2.969
-18.8%
1 Jan 2003 Jahr
15.294
+2.474
19.29%
1 Jan 2004 Jahr
18.349
+3.055
19.97%
1 Jan 2005 Jahr
12.621
-5.727
-31.21%
1 Jan 2006 Jahr
19.792
+7.17
56.81%
1 Jan 2007 Jahr
14.607
-5.185
-26.2%
1 Jan 2008 Jahr
14.607
0.0
0.0%
1 Jan 2009 Jahr
12.727
-1.879
-12.87%
1 Jan 2010 Jahr
7.018
-5.71
-44.86%
1 Jan 2011 Jahr
8.654
+1.636
23.32%
1 Jan 2012 Jahr
9.524
+0.87
10.05%
1 Jan 2013 Jahr
12.346
+2.822
29.63%
1 Jan 2014 Jahr
11.976
-0.37
-2.99%
Bewertung der Länder gemäß mit laufender Statistik nach Jahren


Kommentare: