29
/de/
de
AIzaSyAYiBZKx7MnpbEhh9jyipgxe19OcubqV5w
April 1, 2024
144118
Guatemala
GTM
true
2
1
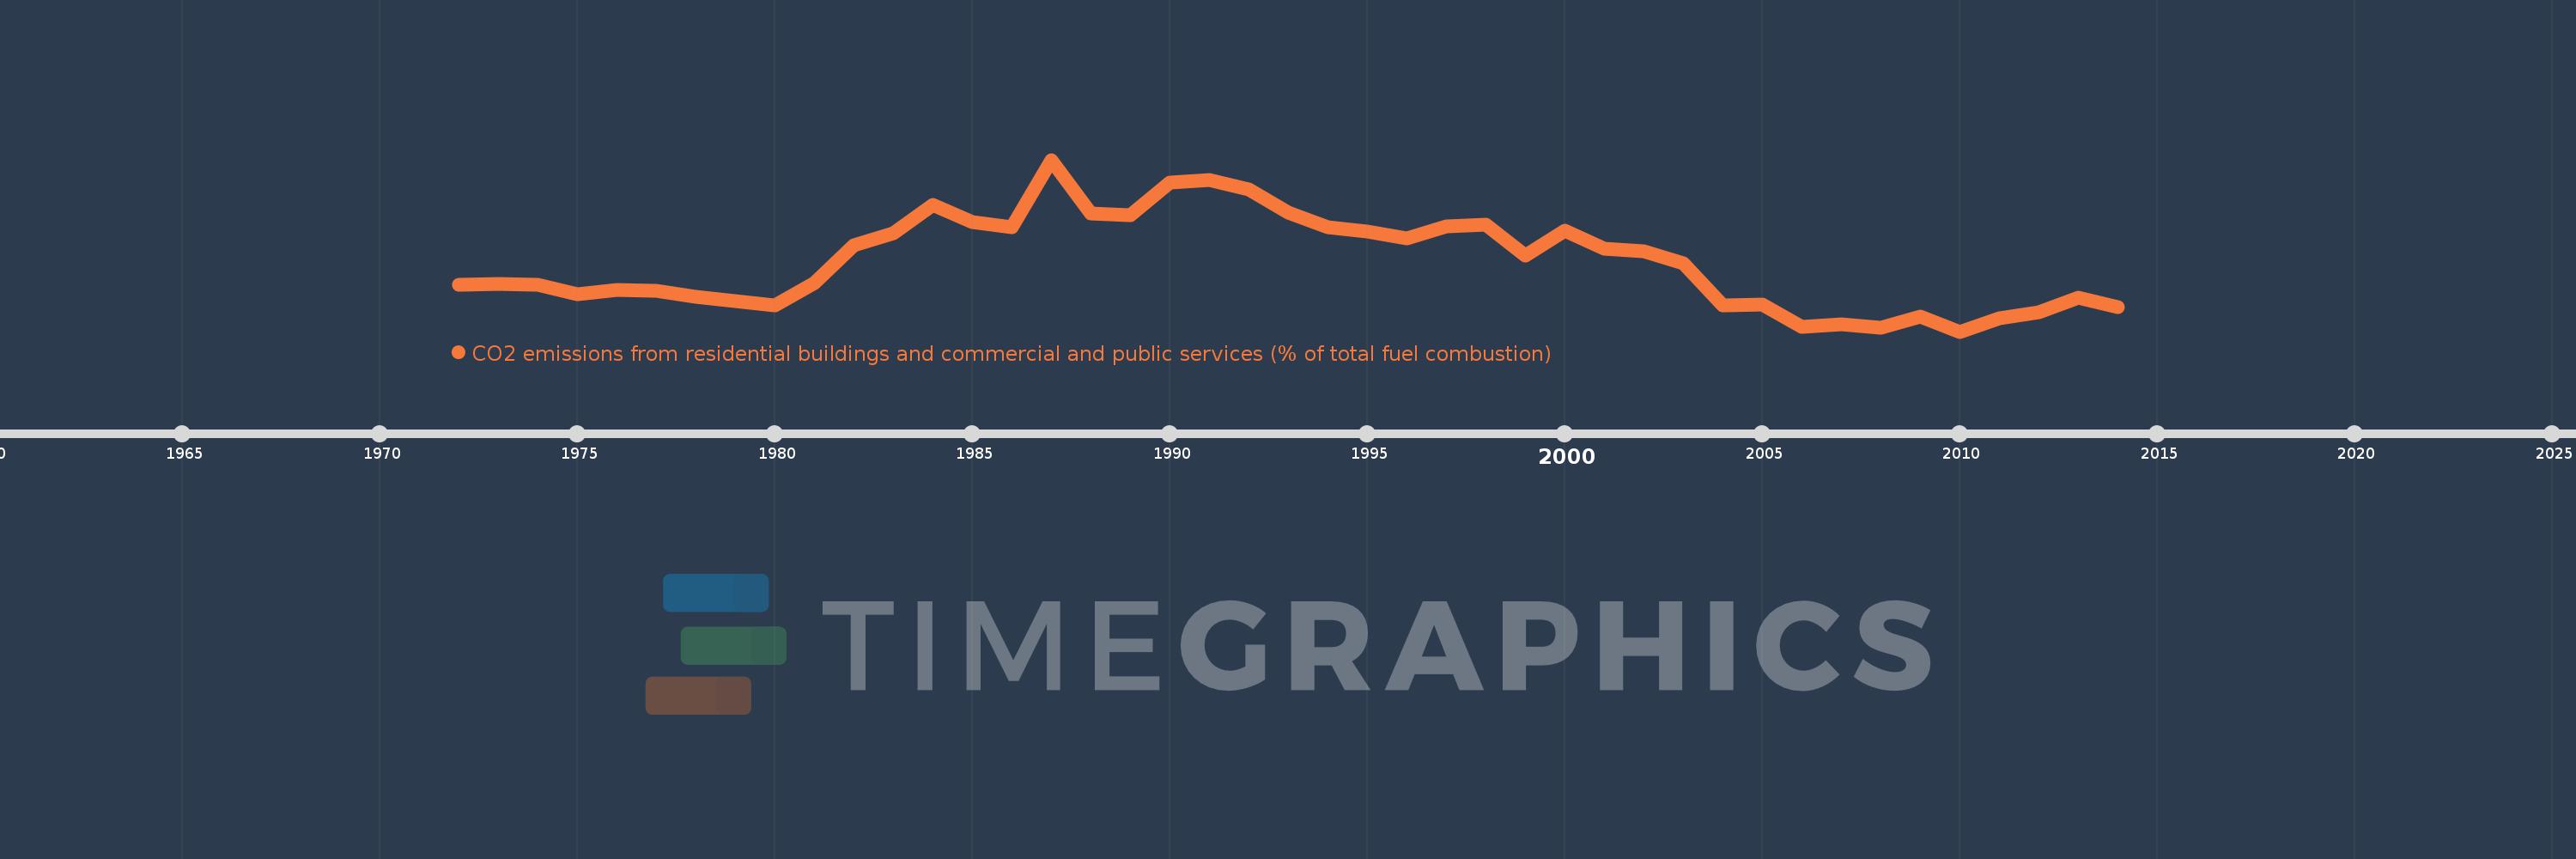
CO2 emissions from residential buildings and commercial and public services (% of total fuel combustion)
2014,2013,2012,2011,2010,2009,2008,2007,2006,2005,2004,2003,2002,2001,2000,1999,1998,1997,1996,1995,1994,1993,1992,1991,1990,1989,1988,1987,1986,1985,1984,1983,1982,1981,1980,1979,1978,1977,1976,1975,1974,1973,1972
Diese Statistik in anderen Ländern:
AlbaniaAlgeriaAngolaArab WorldArgentinaArmeniaAustraliaAustriaAzerbaijanBahrainBangladeshBelarusBelgiumBeninBoliviaBosnia and HerzegovinaBotswanaBrazilBrunei DarussalamBulgariaCambodiaCameroonCanadaCaribbean small statesCentral Europe and the BalticsChileChinaColombiaCongo, Dem. Rep.Congo, Rep.Costa RicaCote d'IvoireCroatiaCubaCuracaoCyprusCzech RepublicDenmarkDominican RepublicEarly-demographic dividendEast Asia & PacificEast Asia & Pacific (excluding high income)East Asia & Pacific (IDA & IBRD countries)EcuadorEgypt, Arab Rep.El SalvadorEritreaEstoniaEthiopiaEuro areaEurope & Central AsiaEurope & Central Asia (excluding high income)Europe & Central Asia (IDA & IBRD countries)European UnionFinlandFragile and conflict affected situationsFranceGabonGeorgiaGermanyGhanaGibraltarGreeceGuatemalaHaitiHeavily indebted poor countries (HIPC)High incomeHondurasHong Kong SAR, ChinaHungaryIBRD onlyIcelandIDA & IBRD totalIDA blendIDA onlyIDA totalIndiaIndonesiaIran, Islamic Rep.IraqIrelandIsraelItalyJamaicaJapanJordanKazakhstanKenyaKorea, Dem. People’s Rep.Korea, Rep.KosovoKuwaitKyrgyz RepublicLate-demographic dividendLatin America & Caribbean Latin America & Caribbean (excluding high income)Latin America & the Caribbean (IDA & IBRD countries)LatviaLeast developed countries: UN classificationLebanonLibyaLithuaniaLow & middle incomeLow incomeLower middle incomeLuxembourgMacedonia, FYRMalaysiaMaltaMauritiusMexicoMiddle East & North AfricaMiddle East & North Africa (excluding high income)Middle East & North Africa (IDA & IBRD countries)Middle incomeMoldovaMongoliaMontenegroMoroccoMozambiqueMyanmarNamibiaNepalNetherlandsNew ZealandNicaraguaNigerNigeriaNorth AmericaNorwayOECD membersOmanOther small statesPakistanPanamaParaguayPeruPhilippinesPolandPortugalPost-demographic dividendPre-demographic dividendQatarRomaniaRussian FederationSaudi ArabiaSenegalSerbiaSingaporeSlovak RepublicSloveniaSmall statesSouth AfricaSouth AsiaSouth Asia (IDA & IBRD)South SudanSpainSri LankaSub-Saharan Africa Sub-Saharan Africa (excluding high income)Sub-Saharan Africa (IDA & IBRD countries)SudanSwedenSwitzerlandSyrian Arab RepublicTajikistanTanzaniaThailandTogoTrinidad and TobagoTunisiaTurkeyTurkmenistanUkraineUnited Arab EmiratesUnited KingdomUnited StatesUpper middle incomeUruguayUzbekistanVenezuela, RBVietnamWorldYemen, Rep.ZambiaZimbabwe Zeitlinie:
Diese Zeitleiste vorliegt die Graphik ab 1972 J. bis 2014 J. Guatemala. Die Angaben bis 1971 J. sind nicht vorhanden. Die Zahl aktueller Beobachtungen nach Daten: 43.
Die Quelle (Bezeichnung):
Kennzahlen der Weltentwicklung
Die Quelle (Einrichtung):
IEA Statistics © OECD/IEA 2014 (http://www.iea.org/stats/index.asp), subject to https://www.iea.org/t&c/termsandconditions/
Kategorien:
Environment
Es wurde aktualisiert:
23 Apr 2017 Jahr
Kennzahlen der Wertänderungen vom Jahr zum Jahr
Minimum:
4.987
1 Jan 2010 Jahr
Maximum:
15.948
1 Jan 1987 Jahr
Zum Datum der Beobachtung
Wert
Absolute Veränderung
Die Veränderung bezüglich dem vorherigen Wert
1 Jan 1972 Jahr
7.965
+7.965
0.0%
1 Jan 1973 Jahr
8.032
+0.068
0.85%
1 Jan 1974 Jahr
7.985
-0.047
-0.59%
1 Jan 1975 Jahr
7.38
-0.605
-7.57%
1 Jan 1976 Jahr
7.641
+0.261
3.54%
1 Jan 1977 Jahr
7.586
-0.055
-0.72%
1 Jan 1978 Jahr
7.186
-0.401
-5.28%
1 Jan 1979 Jahr
6.933
-0.252
-3.51%
1 Jan 1980 Jahr
6.651
-0.283
-4.07%
1 Jan 1981 Jahr
8.076
+1.425
21.43%
1 Jan 1982 Jahr
10.468
+2.392
29.62%
1 Jan 1983 Jahr
11.285
+0.817
7.8%
1 Jan 1984 Jahr
13.091
+1.806
16.0%
1 Jan 1985 Jahr
11.974
-1.117
-8.53%
1 Jan 1986 Jahr
11.635
-0.339
-2.83%
1 Jan 1987 Jahr
15.948
+4.313
37.07%
1 Jan 1988 Jahr
12.5
-3.448
-21.62%
1 Jan 1989 Jahr
12.414
-0.086
-0.69%
1 Jan 1990 Jahr
14.474
+2.06
16.59%
1 Jan 1991 Jahr
14.642
+0.168
1.16%
1 Jan 1992 Jahr
14.076
-0.565
-3.86%
1 Jan 1993 Jahr
12.559
-1.517
-10.78%
1 Jan 1994 Jahr
11.663
-0.896
-7.14%
1 Jan 1995 Jahr
11.382
-0.281
-2.41%
1 Jan 1996 Jahr
10.922
-0.461
-4.05%
1 Jan 1997 Jahr
11.713
+0.792
7.25%
1 Jan 1998 Jahr
11.833
+0.12
1.02%
1 Jan 1999 Jahr
9.817
-2.017
-17.04%
1 Jan 2000 Jahr
11.451
+1.635
16.65%
1 Jan 2001 Jahr
10.256
-1.195
-10.44%
1 Jan 2002 Jahr
10.122
-0.134
-1.31%
1 Jan 2003 Jahr
9.326
-0.796
-7.86%
1 Jan 2004 Jahr
6.639
-2.687
-28.82%
1 Jan 2005 Jahr
6.738
+0.099
1.5%
1 Jan 2006 Jahr
5.273
-1.465
-21.74%
1 Jan 2007 Jahr
5.456
+0.183
3.47%
1 Jan 2008 Jahr
5.231
-0.225
-4.13%
1 Jan 2009 Jahr
5.951
+0.72
13.77%
1 Jan 2010 Jahr
4.987
-0.965
-16.21%
1 Jan 2011 Jahr
5.814
+0.827
16.59%
1 Jan 2012 Jahr
6.202
+0.388
6.68%
1 Jan 2013 Jahr
7.177
+0.974
15.71%
1 Jan 2014 Jahr
6.547
-0.63
-8.78%
Bewertung der Länder gemäß mit laufender Statistik nach Jahren


Kommentare: