29
/de/
de
AIzaSyAYiBZKx7MnpbEhh9jyipgxe19OcubqV5w
April 1, 2024
65644
Algeria
DZA
true
2
1
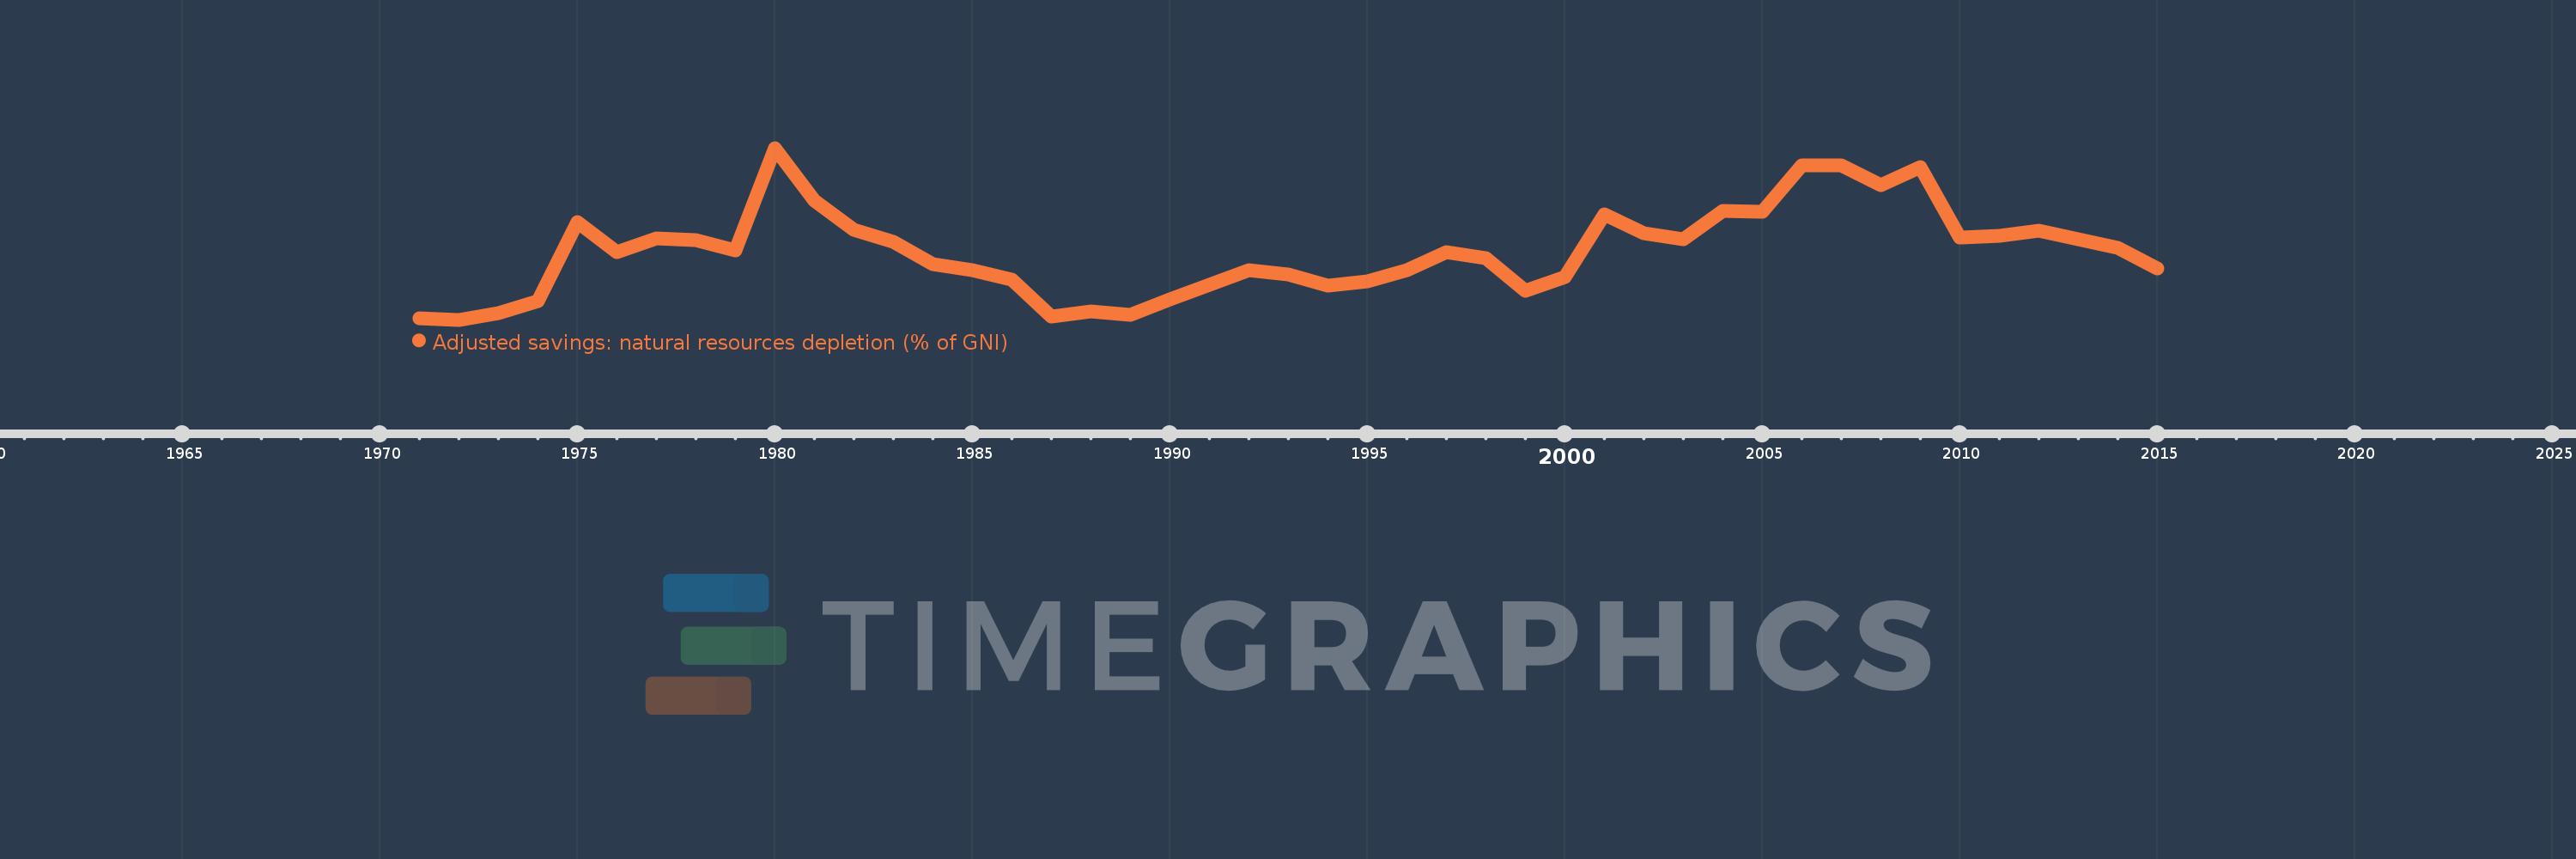
Adjusted savings: natural resources depletion (% of GNI)
2015,2014,2013,2012,2011,2010,2009,2008,2007,2006,2005,2004,2003,2002,2001,2000,1999,1998,1997,1996,1995,1994,1993,1992,1991,1990,1989,1988,1987,1986,1985,1984,1983,1982,1981,1980,1979,1978,1977,1976,1975,1974,1973,1972,1971
Diese Statistik in anderen Ländern:
AfghanistanAlbaniaAlgeriaAngolaArab WorldArgentinaArmeniaAustraliaAustriaAzerbaijanBahamas, TheBahrainBangladeshBarbadosBelarusBelgiumBelizeBeninBhutanBoliviaBotswanaBrazilBrunei DarussalamBulgariaBurkina FasoBurundiCabo VerdeCambodiaCameroonCanadaCaribbean small statesCentral African RepublicCentral Europe and the BalticsChadChileChinaColombiaComorosCongo, Dem. Rep.Congo, Rep.Costa RicaCote d'IvoireCroatiaCubaCyprusCzech RepublicDenmarkDjiboutiDominicaDominican RepublicEarly-demographic dividendEast Asia & PacificEast Asia & Pacific (excluding high income)East Asia & Pacific (IDA & IBRD countries)EcuadorEgypt, Arab Rep.El SalvadorEquatorial GuineaEritreaEstoniaEthiopiaEuro areaEurope & Central AsiaEurope & Central Asia (excluding high income)Europe & Central Asia (IDA & IBRD countries)European UnionFijiFinlandFragile and conflict affected situationsFranceFrench PolynesiaGabonGambia, TheGeorgiaGermanyGhanaGreeceGuatemalaGuineaGuinea-BissauGuyanaHaitiHeavily indebted poor countries (HIPC)High incomeHondurasHong Kong SAR, ChinaHungaryIBRD onlyIcelandIDA & IBRD totalIDA blendIDA onlyIDA totalIndiaIndonesiaIran, Islamic Rep.IraqIrelandIsraelItalyJamaicaJapanJordanKazakhstanKenyaKiribatiKorea, Rep.KuwaitKyrgyz RepublicLao PDRLate-demographic dividendLatin America & Caribbean Latin America & Caribbean (excluding high income)Latin America & the Caribbean (IDA & IBRD countries)LatviaLeast developed countries: UN classificationLebanonLesothoLiberiaLibyaLithuaniaLow & middle incomeLow incomeLower middle incomeLuxembourgMacedonia, FYRMadagascarMalawiMalaysiaMaldivesMaliMauritaniaMauritiusMexicoMicronesia, Fed. Sts.Middle East & North AfricaMiddle East & North Africa (excluding high income)Middle East & North Africa (IDA & IBRD countries)Middle incomeMoldovaMongoliaMoroccoMozambiqueMyanmarNamibiaNepalNetherlandsNew CaledoniaNew ZealandNicaraguaNigerNigeriaNorth AmericaNorwayOECD membersOmanOther small statesPacific island small statesPakistanPanamaPapua New GuineaParaguayPeruPhilippinesPolandPortugalPost-demographic dividendPre-demographic dividendQatarRomaniaRussian FederationRwandaSamoaSao Tome and PrincipeSaudi ArabiaSenegalSeychellesSierra LeoneSingaporeSlovak RepublicSloveniaSmall statesSolomon IslandsSomaliaSouth AfricaSouth AsiaSouth Asia (IDA & IBRD)SpainSri LankaSt. LuciaSt. Vincent and the GrenadinesSub-Saharan Africa Sub-Saharan Africa (excluding high income)Sub-Saharan Africa (IDA & IBRD countries)SudanSurinameSwazilandSwedenSwitzerlandSyrian Arab RepublicTajikistanTanzaniaThailandTogoTongaTrinidad and TobagoTunisiaTurkeyTurkmenistanUgandaUkraineUnited Arab EmiratesUnited KingdomUnited StatesUpper middle incomeUruguayUzbekistanVanuatuVenezuela, RBVietnamWorldYemen, Rep.ZambiaZimbabwe Zeitlinie:
Diese Zeitleiste vorliegt die Graphik ab 1971 J. bis 2015 J. Algeria. Die Angaben bis 1970 J. sind nicht vorhanden. Die Zahl aktueller Beobachtungen nach Daten: 45.
Die Quelle (Bezeichnung):
Kennzahlen der Weltentwicklung
Die Quelle (Einrichtung):
World Bank staff estimates based on sources and methods in World Bank's "The Changing Wealth of Nations: Measuring Sustainable Development in the New Millennium" (2011).
Kategorien:
Economy & Growth, Energy & Mining
Es wurde aktualisiert:
23 Apr 2017 Jahr
Kennzahlen der Wertänderungen vom Jahr zum Jahr
Minimum:
6.344
1 Jan 1972 Jahr
Maximum:
34.231
1 Jan 1980 Jahr
Zum Datum der Beobachtung
Wert
Absolute Veränderung
Die Veränderung bezüglich dem vorherigen Wert
1 Jan 1971 Jahr
6.587
+6.587
0.0%
1 Jan 1972 Jahr
6.344
-0.242
-3.68%
1 Jan 1973 Jahr
7.43
+1.085
17.11%
1 Jan 1974 Jahr
9.333
+1.904
25.62%
1 Jan 1975 Jahr
22.157
+12.824
137.4%
1 Jan 1976 Jahr
17.267
-4.89
-22.07%
1 Jan 1977 Jahr
19.48
+2.213
12.82%
1 Jan 1978 Jahr
19.287
-0.194
-0.99%
1 Jan 1979 Jahr
17.602
-1.685
-8.73%
1 Jan 1980 Jahr
34.231
+16.629
94.47%
1 Jan 1981 Jahr
25.732
-8.498
-24.83%
1 Jan 1982 Jahr
20.93
-4.803
-18.66%
1 Jan 1983 Jahr
18.982
-1.947
-9.3%
1 Jan 1984 Jahr
15.343
-3.639
-19.17%
1 Jan 1985 Jahr
14.4
-0.943
-6.15%
1 Jan 1986 Jahr
12.892
-1.507
-10.47%
1 Jan 1987 Jahr
6.791
-6.102
-47.33%
1 Jan 1988 Jahr
7.75
+0.959
14.12%
1 Jan 1989 Jahr
7.084
-0.666
-8.59%
1 Jan 1990 Jahr
9.599
+2.515
35.5%
1 Jan 1991 Jahr
12.082
+2.483
25.87%
1 Jan 1992 Jahr
14.457
+2.375
19.66%
1 Jan 1993 Jahr
13.748
-0.709
-4.9%
1 Jan 1994 Jahr
11.825
-1.924
-13.99%
1 Jan 1995 Jahr
12.545
+0.72
6.09%
1 Jan 1996 Jahr
14.458
+1.913
15.25%
1 Jan 1997 Jahr
17.274
+2.816
19.47%
1 Jan 1998 Jahr
16.371
-0.902
-5.22%
1 Jan 1999 Jahr
11.046
-5.326
-32.53%
1 Jan 2000 Jahr
13.318
+2.272
20.57%
1 Jan 2001 Jahr
23.482
+10.164
76.32%
1 Jan 2002 Jahr
20.41
-3.073
-13.08%
1 Jan 2003 Jahr
19.381
-1.029
-5.04%
1 Jan 2004 Jahr
23.958
+4.577
23.62%
1 Jan 2005 Jahr
23.812
-0.146
-0.61%
1 Jan 2006 Jahr
31.457
+7.645
32.11%
1 Jan 2007 Jahr
31.424
-0.034
-0.11%
1 Jan 2008 Jahr
28.193
-3.231
-10.28%
1 Jan 2009 Jahr
31.139
+2.946
10.45%
1 Jan 2010 Jahr
19.652
-11.487
-36.89%
1 Jan 2011 Jahr
19.944
+0.292
1.49%
1 Jan 2012 Jahr
20.858
+0.914
4.58%
1 Jan 2013 Jahr
19.392
-1.466
-7.03%
1 Jan 2014 Jahr
17.952
-1.44
-7.43%
1 Jan 2015 Jahr
14.684
-3.268
-18.2%
Bewertung der Länder gemäß mit laufender Statistik nach Jahren


Kommentare: