29
/de/
de
AIzaSyAYiBZKx7MnpbEhh9jyipgxe19OcubqV5w
April 1, 2024
35508
High income
HIC
false
2
1
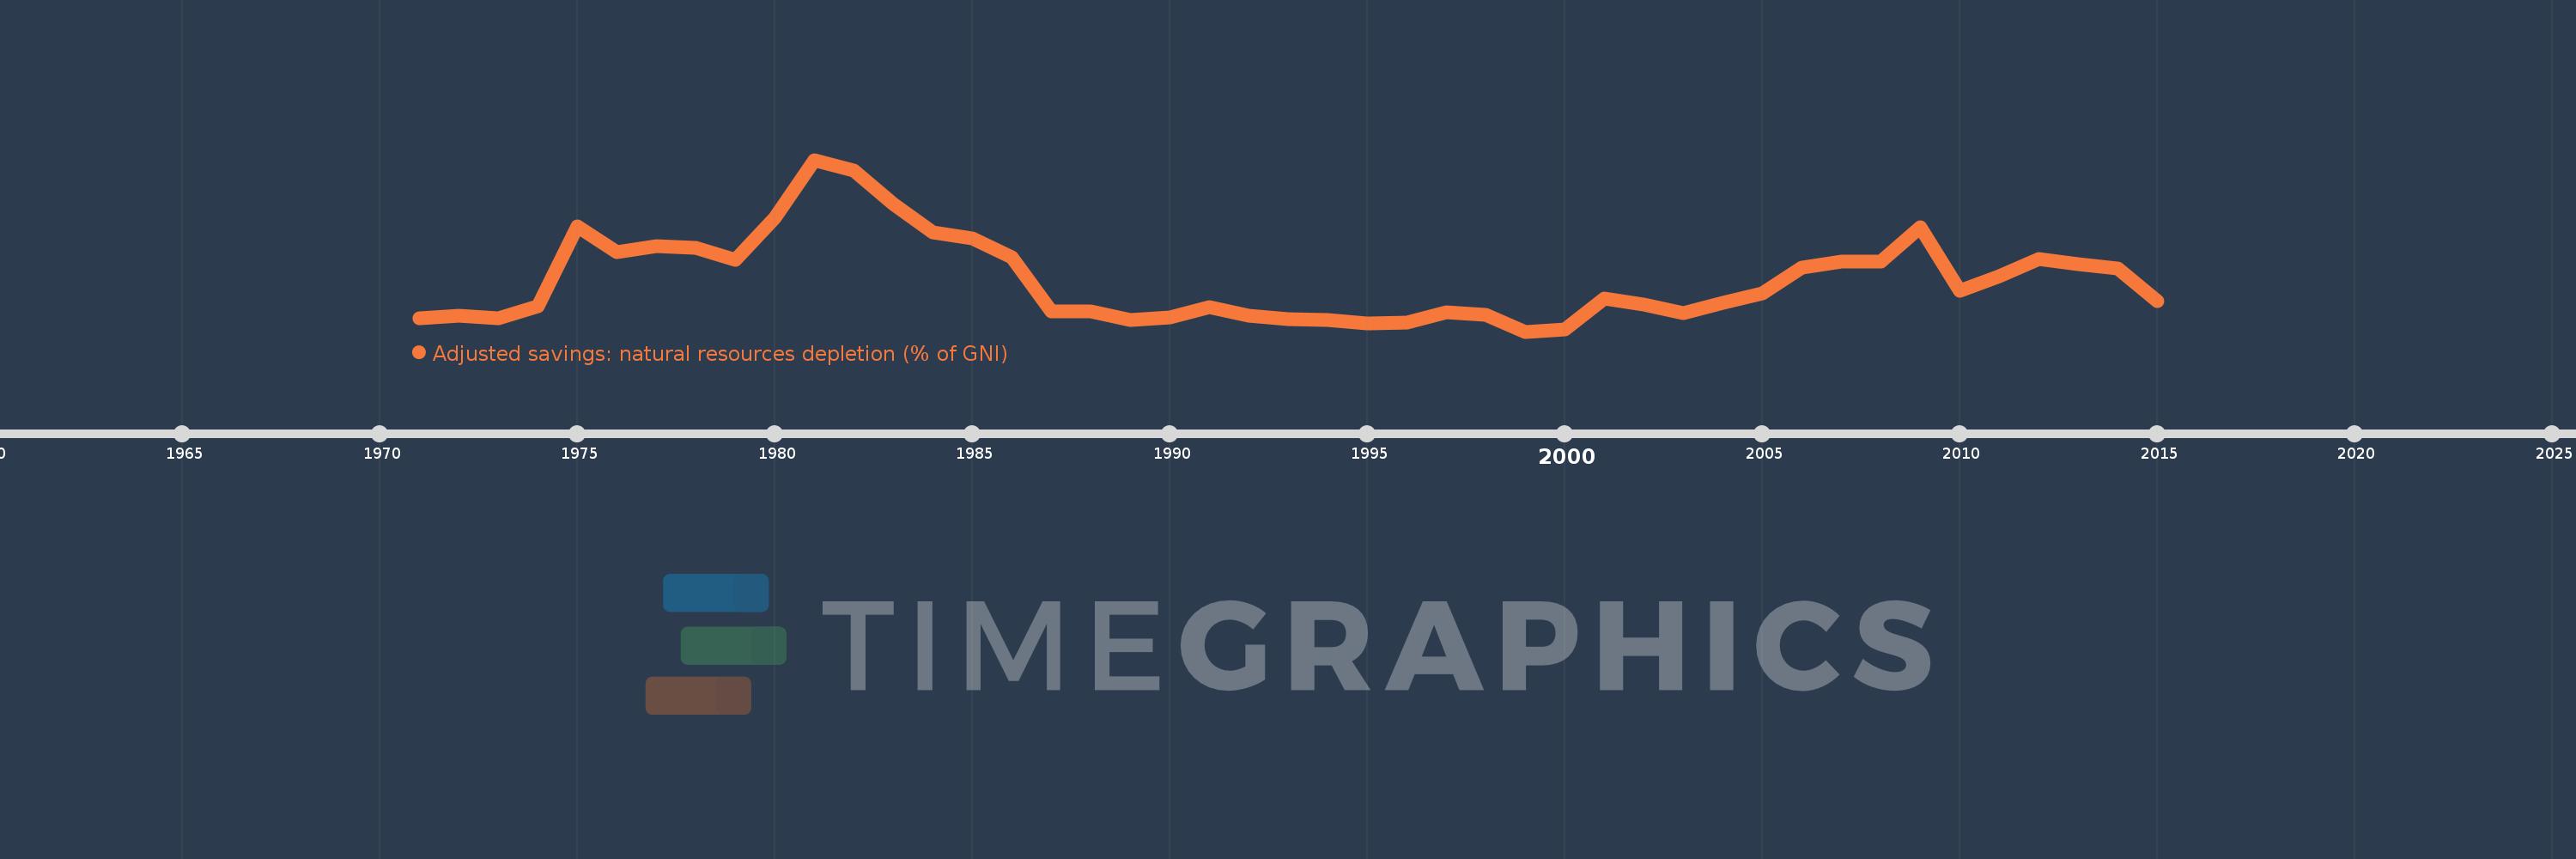
Adjusted savings: natural resources depletion (% of GNI)
2015,2014,2013,2012,2011,2010,2009,2008,2007,2006,2005,2004,2003,2002,2001,2000,1999,1998,1997,1996,1995,1994,1993,1992,1991,1990,1989,1988,1987,1986,1985,1984,1983,1982,1981,1980,1979,1978,1977,1976,1975,1974,1973,1972,1971
Diese Statistik in anderen Ländern:
AfghanistanAlbaniaAlgeriaAngolaArab WorldArgentinaArmeniaAustraliaAustriaAzerbaijanBahamas, TheBahrainBangladeshBarbadosBelarusBelgiumBelizeBeninBhutanBoliviaBotswanaBrazilBrunei DarussalamBulgariaBurkina FasoBurundiCabo VerdeCambodiaCameroonCanadaCaribbean small statesCentral African RepublicCentral Europe and the BalticsChadChileChinaColombiaComorosCongo, Dem. Rep.Congo, Rep.Costa RicaCote d'IvoireCroatiaCubaCyprusCzech RepublicDenmarkDjiboutiDominicaDominican RepublicEarly-demographic dividendEast Asia & PacificEast Asia & Pacific (excluding high income)East Asia & Pacific (IDA & IBRD countries)EcuadorEgypt, Arab Rep.El SalvadorEquatorial GuineaEritreaEstoniaEthiopiaEuro areaEurope & Central AsiaEurope & Central Asia (excluding high income)Europe & Central Asia (IDA & IBRD countries)European UnionFijiFinlandFragile and conflict affected situationsFranceFrench PolynesiaGabonGambia, TheGeorgiaGermanyGhanaGreeceGuatemalaGuineaGuinea-BissauGuyanaHaitiHeavily indebted poor countries (HIPC)High incomeHondurasHong Kong SAR, ChinaHungaryIBRD onlyIcelandIDA & IBRD totalIDA blendIDA onlyIDA totalIndiaIndonesiaIran, Islamic Rep.IraqIrelandIsraelItalyJamaicaJapanJordanKazakhstanKenyaKiribatiKorea, Rep.KuwaitKyrgyz RepublicLao PDRLate-demographic dividendLatin America & Caribbean Latin America & Caribbean (excluding high income)Latin America & the Caribbean (IDA & IBRD countries)LatviaLeast developed countries: UN classificationLebanonLesothoLiberiaLibyaLithuaniaLow & middle incomeLow incomeLower middle incomeLuxembourgMacedonia, FYRMadagascarMalawiMalaysiaMaldivesMaliMauritaniaMauritiusMexicoMicronesia, Fed. Sts.Middle East & North AfricaMiddle East & North Africa (excluding high income)Middle East & North Africa (IDA & IBRD countries)Middle incomeMoldovaMongoliaMoroccoMozambiqueMyanmarNamibiaNepalNetherlandsNew CaledoniaNew ZealandNicaraguaNigerNigeriaNorth AmericaNorwayOECD membersOmanOther small statesPacific island small statesPakistanPanamaPapua New GuineaParaguayPeruPhilippinesPolandPortugalPost-demographic dividendPre-demographic dividendQatarRomaniaRussian FederationRwandaSamoaSao Tome and PrincipeSaudi ArabiaSenegalSeychellesSierra LeoneSingaporeSlovak RepublicSloveniaSmall statesSolomon IslandsSomaliaSouth AfricaSouth AsiaSouth Asia (IDA & IBRD)SpainSri LankaSt. LuciaSt. Vincent and the GrenadinesSub-Saharan Africa Sub-Saharan Africa (excluding high income)Sub-Saharan Africa (IDA & IBRD countries)SudanSurinameSwazilandSwedenSwitzerlandSyrian Arab RepublicTajikistanTanzaniaThailandTogoTongaTrinidad and TobagoTunisiaTurkeyTurkmenistanUgandaUkraineUnited Arab EmiratesUnited KingdomUnited StatesUpper middle incomeUruguayUzbekistanVanuatuVenezuela, RBVietnamWorldYemen, Rep.ZambiaZimbabwe Zeitlinie:
Diese Zeitleiste vorliegt die Graphik ab 1971 J. bis 2015 J. High income. Die Angaben bis 1970 J. sind nicht vorhanden. Die Zahl aktueller Beobachtungen nach Daten: 45.
Die Quelle (Bezeichnung):
Kennzahlen der Weltentwicklung
Die Quelle (Einrichtung):
World Bank staff estimates based on sources and methods in World Bank's "The Changing Wealth of Nations: Measuring Sustainable Development in the New Millennium" (2011).
Kategorien:
Economy & Growth, Energy & Mining
Es wurde aktualisiert:
23 Apr 2017 Jahr
Kennzahlen der Wertänderungen vom Jahr zum Jahr
Minimum:
0.354
1 Jan 1999 Jahr
Maximum:
3.207
1 Jan 1981 Jahr
Zum Datum der Beobachtung
Wert
Absolute Veränderung
Die Veränderung bezüglich dem vorherigen Wert
1 Jan 1971 Jahr
0.573
+0.573
0.0%
1 Jan 1972 Jahr
0.619
+0.046
7.94%
1 Jan 1973 Jahr
0.581
-0.037
-6.06%
1 Jan 1974 Jahr
0.774
+0.193
33.2%
1 Jan 1975 Jahr
2.107
+1.333
172.23%
1 Jan 1976 Jahr
1.677
-0.43
-20.41%
1 Jan 1977 Jahr
1.77
+0.093
5.55%
1 Jan 1978 Jahr
1.744
-0.026
-1.47%
1 Jan 1979 Jahr
1.55
-0.194
-11.13%
1 Jan 1980 Jahr
2.244
+0.694
44.74%
1 Jan 1981 Jahr
3.207
+0.963
42.94%
1 Jan 1982 Jahr
3.024
-0.183
-5.71%
1 Jan 1983 Jahr
2.475
-0.549
-18.16%
1 Jan 1984 Jahr
2.002
-0.472
-19.09%
1 Jan 1985 Jahr
1.907
-0.095
-4.76%
1 Jan 1986 Jahr
1.593
-0.314
-16.49%
1 Jan 1987 Jahr
0.689
-0.904
-56.73%
1 Jan 1988 Jahr
0.693
+0.004
0.51%
1 Jan 1989 Jahr
0.54
-0.153
-22.05%
1 Jan 1990 Jahr
0.59
+0.05
9.31%
1 Jan 1991 Jahr
0.755
+0.165
28.01%
1 Jan 1992 Jahr
0.623
-0.132
-17.49%
1 Jan 1993 Jahr
0.562
-0.062
-9.9%
1 Jan 1994 Jahr
0.546
-0.016
-2.79%
1 Jan 1995 Jahr
0.496
-0.05
-9.15%
1 Jan 1996 Jahr
0.504
+0.008
1.63%
1 Jan 1997 Jahr
0.67
+0.166
33.01%
1 Jan 1998 Jahr
0.626
-0.045
-6.7%
1 Jan 1999 Jahr
0.354
-0.271
-43.38%
1 Jan 2000 Jahr
0.393
+0.039
10.94%
1 Jan 2001 Jahr
0.909
+0.516
131.35%
1 Jan 2002 Jahr
0.798
-0.111
-12.19%
1 Jan 2003 Jahr
0.661
-0.137
-17.14%
1 Jan 2004 Jahr
0.831
+0.17
25.66%
1 Jan 2005 Jahr
0.995
+0.164
19.72%
1 Jan 2006 Jahr
1.417
+0.422
42.42%
1 Jan 2007 Jahr
1.521
+0.104
7.34%
1 Jan 2008 Jahr
1.514
-0.007
-0.49%
1 Jan 2009 Jahr
2.087
+0.573
37.87%
1 Jan 2010 Jahr
1.035
-1.052
-50.42%
1 Jan 2011 Jahr
1.271
+0.237
22.86%
1 Jan 2012 Jahr
1.554
+0.283
22.23%
1 Jan 2013 Jahr
1.467
-0.087
-5.59%
1 Jan 2014 Jahr
1.407
-0.06
-4.12%
1 Jan 2015 Jahr
0.856
-0.551
-39.14%
Bewertung der Länder gemäß mit laufender Statistik nach Jahren


Kommentare: