29
/de/
de
AIzaSyAYiBZKx7MnpbEhh9jyipgxe19OcubqV5w
April 1, 2024
106821
Colombia
COL
true
2
1
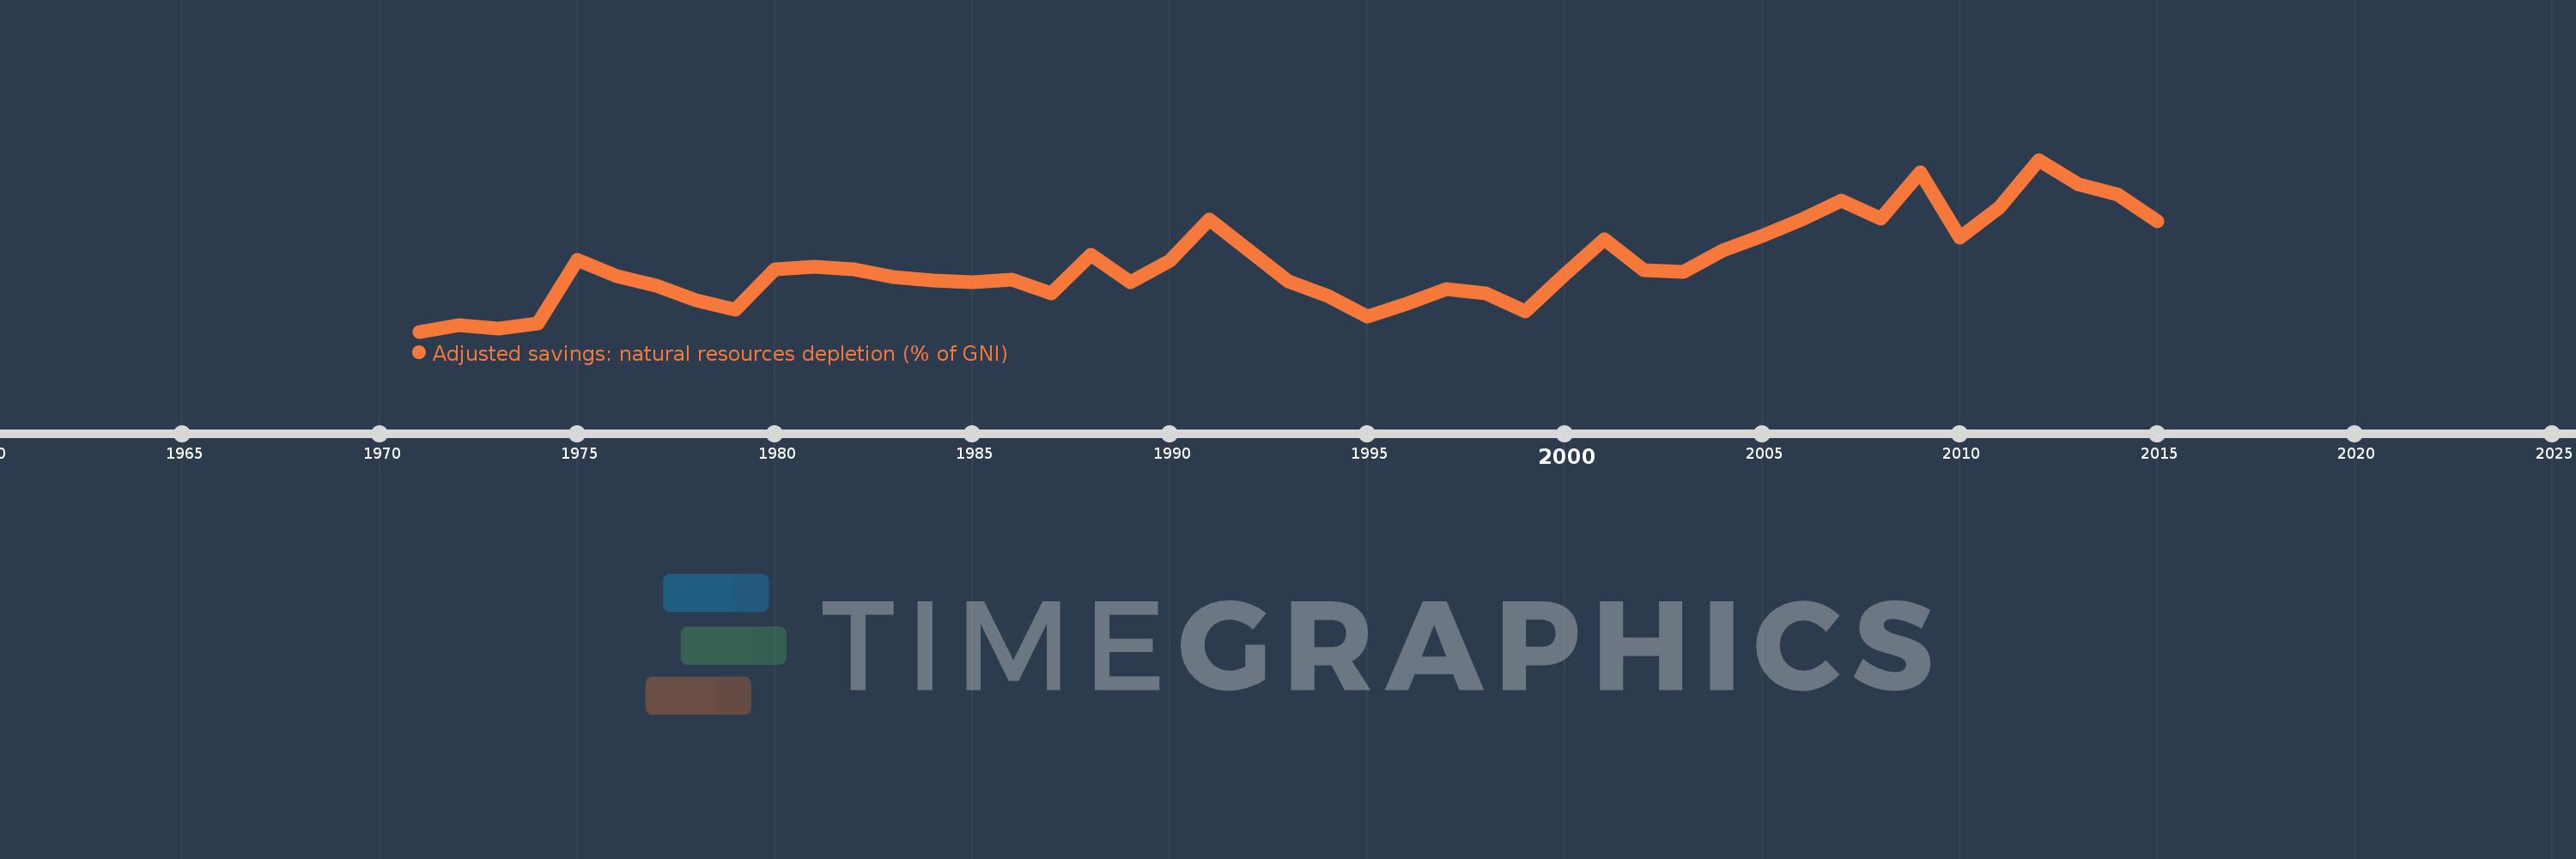
Adjusted savings: natural resources depletion (% of GNI)
2015,2014,2013,2012,2011,2010,2009,2008,2007,2006,2005,2004,2003,2002,2001,2000,1999,1998,1997,1996,1995,1994,1993,1992,1991,1990,1989,1988,1987,1986,1985,1984,1983,1982,1981,1980,1979,1978,1977,1976,1975,1974,1973,1972,1971
Diese Statistik in anderen Ländern:
AfghanistanAlbaniaAlgeriaAngolaArab WorldArgentinaArmeniaAustraliaAustriaAzerbaijanBahamas, TheBahrainBangladeshBarbadosBelarusBelgiumBelizeBeninBhutanBoliviaBotswanaBrazilBrunei DarussalamBulgariaBurkina FasoBurundiCabo VerdeCambodiaCameroonCanadaCaribbean small statesCentral African RepublicCentral Europe and the BalticsChadChileChinaColombiaComorosCongo, Dem. Rep.Congo, Rep.Costa RicaCote d'IvoireCroatiaCubaCyprusCzech RepublicDenmarkDjiboutiDominicaDominican RepublicEarly-demographic dividendEast Asia & PacificEast Asia & Pacific (excluding high income)East Asia & Pacific (IDA & IBRD countries)EcuadorEgypt, Arab Rep.El SalvadorEquatorial GuineaEritreaEstoniaEthiopiaEuro areaEurope & Central AsiaEurope & Central Asia (excluding high income)Europe & Central Asia (IDA & IBRD countries)European UnionFijiFinlandFragile and conflict affected situationsFranceFrench PolynesiaGabonGambia, TheGeorgiaGermanyGhanaGreeceGuatemalaGuineaGuinea-BissauGuyanaHaitiHeavily indebted poor countries (HIPC)High incomeHondurasHong Kong SAR, ChinaHungaryIBRD onlyIcelandIDA & IBRD totalIDA blendIDA onlyIDA totalIndiaIndonesiaIran, Islamic Rep.IraqIrelandIsraelItalyJamaicaJapanJordanKazakhstanKenyaKiribatiKorea, Rep.KuwaitKyrgyz RepublicLao PDRLate-demographic dividendLatin America & Caribbean Latin America & Caribbean (excluding high income)Latin America & the Caribbean (IDA & IBRD countries)LatviaLeast developed countries: UN classificationLebanonLesothoLiberiaLibyaLithuaniaLow & middle incomeLow incomeLower middle incomeLuxembourgMacedonia, FYRMadagascarMalawiMalaysiaMaldivesMaliMauritaniaMauritiusMexicoMicronesia, Fed. Sts.Middle East & North AfricaMiddle East & North Africa (excluding high income)Middle East & North Africa (IDA & IBRD countries)Middle incomeMoldovaMongoliaMoroccoMozambiqueMyanmarNamibiaNepalNetherlandsNew CaledoniaNew ZealandNicaraguaNigerNigeriaNorth AmericaNorwayOECD membersOmanOther small statesPacific island small statesPakistanPanamaPapua New GuineaParaguayPeruPhilippinesPolandPortugalPost-demographic dividendPre-demographic dividendQatarRomaniaRussian FederationRwandaSamoaSao Tome and PrincipeSaudi ArabiaSenegalSeychellesSierra LeoneSingaporeSlovak RepublicSloveniaSmall statesSolomon IslandsSomaliaSouth AfricaSouth AsiaSouth Asia (IDA & IBRD)SpainSri LankaSt. LuciaSt. Vincent and the GrenadinesSub-Saharan Africa Sub-Saharan Africa (excluding high income)Sub-Saharan Africa (IDA & IBRD countries)SudanSurinameSwazilandSwedenSwitzerlandSyrian Arab RepublicTajikistanTanzaniaThailandTogoTongaTrinidad and TobagoTunisiaTurkeyTurkmenistanUgandaUkraineUnited Arab EmiratesUnited KingdomUnited StatesUpper middle incomeUruguayUzbekistanVanuatuVenezuela, RBVietnamWorldYemen, Rep.ZambiaZimbabwe Zeitlinie:
Diese Zeitleiste vorliegt die Graphik ab 1971 J. bis 2015 J. Colombia. Die Angaben bis 1970 J. sind nicht vorhanden. Die Zahl aktueller Beobachtungen nach Daten: 45.
Die Quelle (Bezeichnung):
Kennzahlen der Weltentwicklung
Die Quelle (Einrichtung):
World Bank staff estimates based on sources and methods in World Bank's "The Changing Wealth of Nations: Measuring Sustainable Development in the New Millennium" (2011).
Kategorien:
Economy & Growth, Energy & Mining
Es wurde aktualisiert:
23 Apr 2017 Jahr
Kennzahlen der Wertänderungen vom Jahr zum Jahr
Minimum:
1.183
1 Jan 1971 Jahr
Maximum:
9.977
1 Jan 2012 Jahr
Zum Datum der Beobachtung
Wert
Absolute Veränderung
Die Veränderung bezüglich dem vorherigen Wert
1 Jan 1971 Jahr
1.183
+1.183
0.0%
1 Jan 1972 Jahr
1.518
+0.335
28.31%
1 Jan 1973 Jahr
1.322
-0.196
-12.93%
1 Jan 1974 Jahr
1.599
+0.277
20.93%
1 Jan 1975 Jahr
4.861
+3.263
204.1%
1 Jan 1976 Jahr
4.021
-0.84
-17.27%
1 Jan 1977 Jahr
3.538
-0.484
-12.03%
1 Jan 1978 Jahr
2.804
-0.734
-20.75%
1 Jan 1979 Jahr
2.323
-0.481
-17.14%
1 Jan 1980 Jahr
4.387
+2.064
88.85%
1 Jan 1981 Jahr
4.494
+0.107
2.43%
1 Jan 1982 Jahr
4.378
-0.116
-2.59%
1 Jan 1983 Jahr
3.956
-0.421
-9.63%
1 Jan 1984 Jahr
3.812
-0.144
-3.65%
1 Jan 1985 Jahr
3.7
-0.112
-2.93%
1 Jan 1986 Jahr
3.862
+0.162
4.38%
1 Jan 1987 Jahr
3.155
-0.707
-18.31%
1 Jan 1988 Jahr
5.11
+1.955
61.96%
1 Jan 1989 Jahr
3.708
-1.402
-27.44%
1 Jan 1990 Jahr
4.832
+1.124
30.31%
1 Jan 1991 Jahr
6.901
+2.069
42.83%
1 Jan 1992 Jahr
5.341
-1.56
-22.61%
1 Jan 1993 Jahr
3.768
-1.573
-29.45%
1 Jan 1994 Jahr
3.012
-0.756
-20.05%
1 Jan 1995 Jahr
1.957
-1.055
-35.03%
1 Jan 1996 Jahr
2.609
+0.652
33.29%
1 Jan 1997 Jahr
3.371
+0.763
29.23%
1 Jan 1998 Jahr
3.131
-0.241
-7.14%
1 Jan 1999 Jahr
2.237
-0.894
-28.56%
1 Jan 2000 Jahr
4.121
+1.884
84.25%
1 Jan 2001 Jahr
5.912
+1.791
43.45%
1 Jan 2002 Jahr
4.32
-1.592
-26.93%
1 Jan 2003 Jahr
4.223
-0.096
-2.23%
1 Jan 2004 Jahr
5.328
+1.104
26.15%
1 Jan 2005 Jahr
6.075
+0.748
14.03%
1 Jan 2006 Jahr
6.903
+0.827
13.62%
1 Jan 2007 Jahr
7.874
+0.972
14.08%
1 Jan 2008 Jahr
6.983
-0.891
-11.31%
1 Jan 2009 Jahr
9.318
+2.335
33.43%
1 Jan 2010 Jahr
5.978
-3.341
-35.85%
1 Jan 2011 Jahr
7.517
+1.54
25.75%
1 Jan 2012 Jahr
9.977
+2.46
32.73%
1 Jan 2013 Jahr
8.725
-1.252
-12.55%
1 Jan 2014 Jahr
8.204
-0.521
-5.98%
1 Jan 2015 Jahr
6.83
-1.374
-16.75%
Bewertung der Länder gemäß mit laufender Statistik nach Jahren


Kommentare: