29
/de/
de
AIzaSyAYiBZKx7MnpbEhh9jyipgxe19OcubqV5w
April 1, 2024
62666
World
WLD
false
2
1
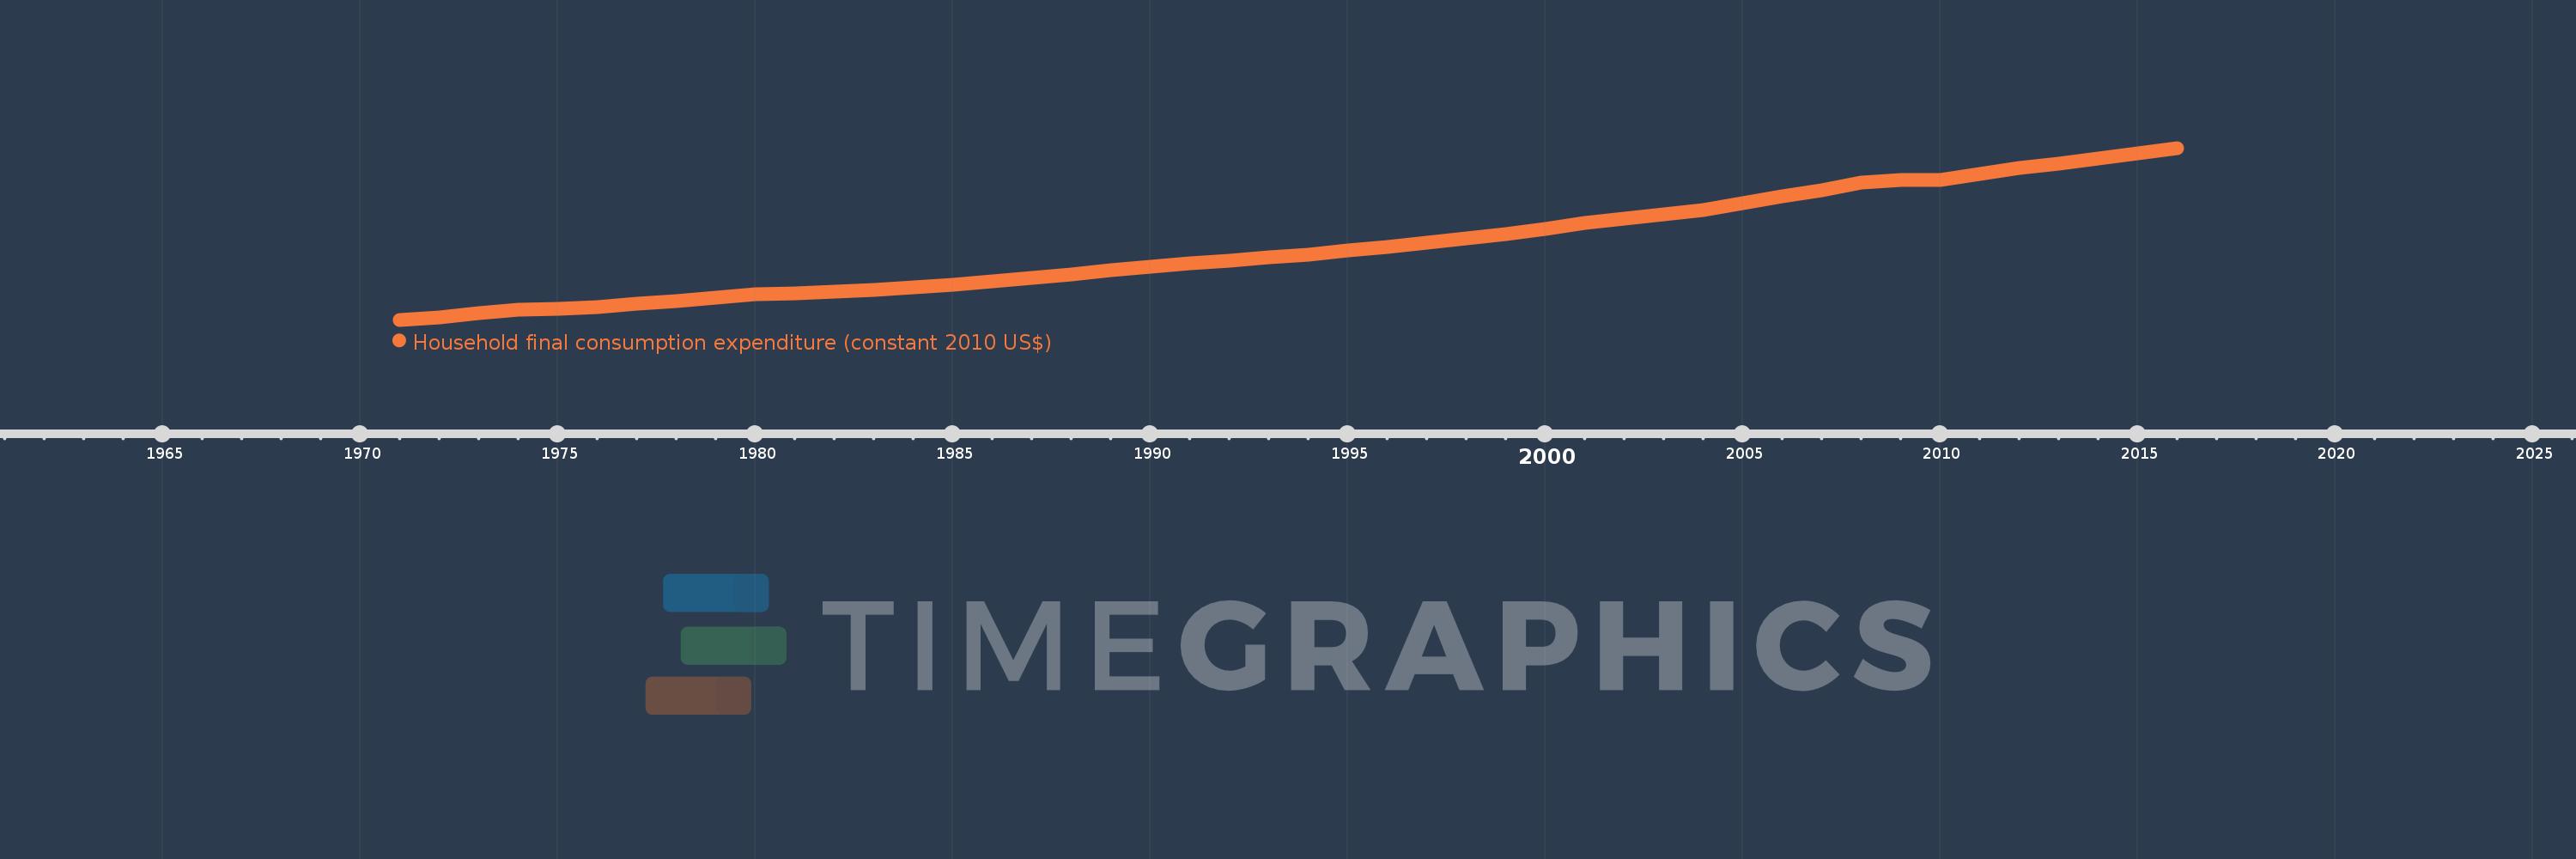
Household final consumption expenditure (constant 2010 US$)
2016,2015,2014,2013,2012,2011,2010,2009,2008,2007,2006,2005,2004,2003,2002,2001,2000,1999,1998,1997,1996,1995,1994,1993,1992,1991,1990,1989,1988,1987,1986,1985,1984,1983,1982,1981,1980,1979,1978,1977,1976,1975,1974,1973,1972,1971
Diese Statistik in anderen Ländern:
AfghanistanAlbaniaAlgeriaAngolaAntigua and BarbudaArab WorldArgentinaArmeniaArubaAustraliaAustriaAzerbaijanBahamas, TheBahrainBangladeshBarbadosBelarusBelgiumBelizeBeninBermudaBhutanBoliviaBosnia and HerzegovinaBotswanaBrazilBrunei DarussalamBulgariaBurkina FasoBurundiCabo VerdeCambodiaCameroonCanadaCaribbean small statesCentral African RepublicCentral Europe and the BalticsChadChileChinaColombiaComorosCongo, Dem. Rep.Congo, Rep.Costa RicaCote d'IvoireCroatiaCubaCyprusCzech RepublicDenmarkDominicaDominican RepublicEarly-demographic dividendEast Asia & PacificEast Asia & Pacific (excluding high income)East Asia & Pacific (IDA & IBRD countries)EcuadorEgypt, Arab Rep.El SalvadorEquatorial GuineaEritreaEstoniaEuro areaEurope & Central AsiaEurope & Central Asia (excluding high income)Europe & Central Asia (IDA & IBRD countries)European UnionFaroe IslandsFinlandFranceGabonGambia, TheGeorgiaGermanyGhanaGreeceGrenadaGuatemalaGuineaGuinea-BissauGuyanaHaitiHeavily indebted poor countries (HIPC)High incomeHondurasHong Kong SAR, ChinaHungaryIBRD onlyIcelandIDA & IBRD totalIDA blendIDA onlyIDA totalIndiaIndonesiaIran, Islamic Rep.IrelandIsraelItalyJamaicaJapanJordanKazakhstanKenyaKorea, Rep.KosovoKuwaitKyrgyz RepublicLao PDRLate-demographic dividendLatin America & Caribbean Latin America & Caribbean (excluding high income)Latin America & the Caribbean (IDA & IBRD countries)LatviaLeast developed countries: UN classificationLebanonLiberiaLithuaniaLow & middle incomeLow incomeLower middle incomeLuxembourgMacao SAR, ChinaMacedonia, FYRMadagascarMalawiMalaysiaMaliMaltaMauritaniaMauritiusMexicoMiddle East & North AfricaMiddle East & North Africa (excluding high income)Middle East & North Africa (IDA & IBRD countries)Middle incomeMoldovaMongoliaMontenegroMoroccoMozambiqueNamibiaNepalNetherlandsNew ZealandNicaraguaNigerNigeriaNorth AmericaNorwayOECD membersOmanOther small statesPakistanPanamaParaguayPeruPhilippinesPolandPortugalPost-demographic dividendPre-demographic dividendPuerto RicoQatarRomaniaRussian FederationRwandaSaudi ArabiaSenegalSerbiaSeychellesSierra LeoneSingaporeSlovak RepublicSloveniaSmall statesSouth AfricaSouth AsiaSouth Asia (IDA & IBRD)South SudanSpainSri LankaSt. Kitts and NevisSt. LuciaSt. Vincent and the GrenadinesSub-Saharan Africa Sub-Saharan Africa (excluding high income)Sub-Saharan Africa (IDA & IBRD countries)SudanSurinameSwazilandSwedenSwitzerlandTajikistanTanzaniaThailandTimor-LesteTogoTongaTrinidad and TobagoTunisiaTurkeyTurkmenistanUgandaUkraineUnited Arab EmiratesUnited KingdomUnited StatesUpper middle incomeUruguayUzbekistanVanuatuVenezuela, RBVietnamWest Bank and GazaWorldYemen, Rep.ZambiaZimbabwe Zeitlinie:
Diese Zeitleiste vorliegt die Graphik ab 1971 J. bis 2016 J. World. Die Angaben bis 1970 J. sind nicht vorhanden. Die Zahl aktueller Beobachtungen nach Daten: 46.
Die Quelle (Bezeichnung):
Kennzahlen der Weltentwicklung
Die Quelle (Einrichtung):
World Bank national accounts data, and OECD National Accounts data files.
Kategorien:
Economy & Growth
Es wurde aktualisiert:
23 Apr 2017 Jahr
Kennzahlen der Wertänderungen vom Jahr zum Jahr
im Durchschnitt:
24.454 Trln
Minimum:
10.81 Trln
1 Jan 1971 Jahr
Maximum:
42.742 Trln
1 Jan 2016 Jahr
Zum Datum der Beobachtung
Wert
Absolute Veränderung
Die Veränderung bezüglich dem vorherigen Wert
1 Jan 1971 Jahr
10.81 Trln
+10.81 Trln
0.0%
1 Jan 1972 Jahr
11.316 Trln
+506.049 Mlrd.
4.68%
1 Jan 1973 Jahr
11.984 Trln
+668.128 Mlrd.
5.9%
1 Jan 1974 Jahr
12.662 Trln
+678.597 Mlrd.
5.66%
1 Jan 1975 Jahr
12.83 Trln
+167.126 Mlrd.
1.32%
1 Jan 1976 Jahr
13.15 Trln
+320.641 Mlrd.
2.5%
1 Jan 1977 Jahr
13.76 Trln
+609.487 Mlrd.
4.63%
1 Jan 1978 Jahr
14.324 Trln
+564.409 Mlrd.
4.1%
1 Jan 1979 Jahr
14.898 Trln
+573.642 Mlrd.
4.0%
1 Jan 1980 Jahr
15.511 Trln
+613.418 Mlrd.
4.12%
1 Jan 1981 Jahr
15.785 Trln
+274.212 Mlrd.
1.77%
1 Jan 1982 Jahr
16.049 Trln
+264.06 Mlrd.
1.67%
1 Jan 1983 Jahr
16.311 Trln
+262.054 Mlrd.
1.63%
1 Jan 1984 Jahr
16.808 Trln
+496.027 Mlrd.
3.04%
1 Jan 1985 Jahr
17.383 Trln
+575.35 Mlrd.
3.42%
1 Jan 1986 Jahr
18.0 Trln
+617.514 Mlrd.
3.55%
1 Jan 1987 Jahr
18.634 Trln
+633.59 Mlrd.
3.52%
1 Jan 1988 Jahr
19.233 Trln
+599.237 Mlrd.
3.22%
1 Jan 1989 Jahr
20.011 Trln
+778.091 Mlrd.
4.05%
1 Jan 1990 Jahr
20.672 Trln
+660.759 Mlrd.
3.3%
1 Jan 1991 Jahr
21.378 Trln
+706.23 Mlrd.
3.42%
1 Jan 1992 Jahr
21.747 Trln
+368.521 Mlrd.
1.72%
1 Jan 1993 Jahr
22.354 Trln
+606.931 Mlrd.
2.79%
1 Jan 1994 Jahr
22.913 Trln
+558.888 Mlrd.
2.5%
1 Jan 1995 Jahr
23.625 Trln
+712.848 Mlrd.
3.11%
1 Jan 1996 Jahr
24.297 Trln
+671.646 Mlrd.
2.84%
1 Jan 1997 Jahr
25.139 Trln
+841.444 Mlrd.
3.46%
1 Jan 1998 Jahr
25.952 Trln
+813.151 Mlrd.
3.23%
1 Jan 1999 Jahr
26.698 Trln
+746.193 Mlrd.
2.88%
1 Jan 2000 Jahr
27.706 Trln
+1.008 Trln
3.78%
1 Jan 2001 Jahr
28.842 Trln
+1.136 Trln
4.1%
1 Jan 2002 Jahr
29.634 Trln
+791.841 Mlrd.
2.75%
1 Jan 2003 Jahr
30.383 Trln
+749.768 Mlrd.
2.53%
1 Jan 2004 Jahr
31.205 Trln
+821.24 Mlrd.
2.7%
1 Jan 2005 Jahr
32.407 Trln
+1.203 Trln
3.85%
1 Jan 2006 Jahr
33.677 Trln
+1.27 Trln
3.92%
1 Jan 2007 Jahr
34.884 Trln
+1.207 Trln
3.58%
1 Jan 2008 Jahr
36.289 Trln
+1.405 Trln
4.03%
1 Jan 2009 Jahr
36.845 Trln
+556.457 Mlrd.
1.53%
1 Jan 2010 Jahr
36.752 Trln
-93.815 Mlrd.
-0.25%
1 Jan 2011 Jahr
37.882 Trln
+1.13 Trln
3.07%
1 Jan 2012 Jahr
39.0 Trln
+1.119 Trln
2.95%
1 Jan 2013 Jahr
39.862 Trln
+861.204 Mlrd.
2.21%
1 Jan 2014 Jahr
40.767 Trln
+905.922 Mlrd.
2.27%
1 Jan 2015 Jahr
41.751 Trln
+983.276 Mlrd.
2.41%
1 Jan 2016 Jahr
42.742 Trln
+991.532 Mlrd.
2.37%
Bewertung der Länder gemäß mit laufender Statistik nach Jahren


Kommentare: