29
/de/
de
AIzaSyAYiBZKx7MnpbEhh9jyipgxe19OcubqV5w
April 1, 2024
161560
Italy
ITA
true
2
1
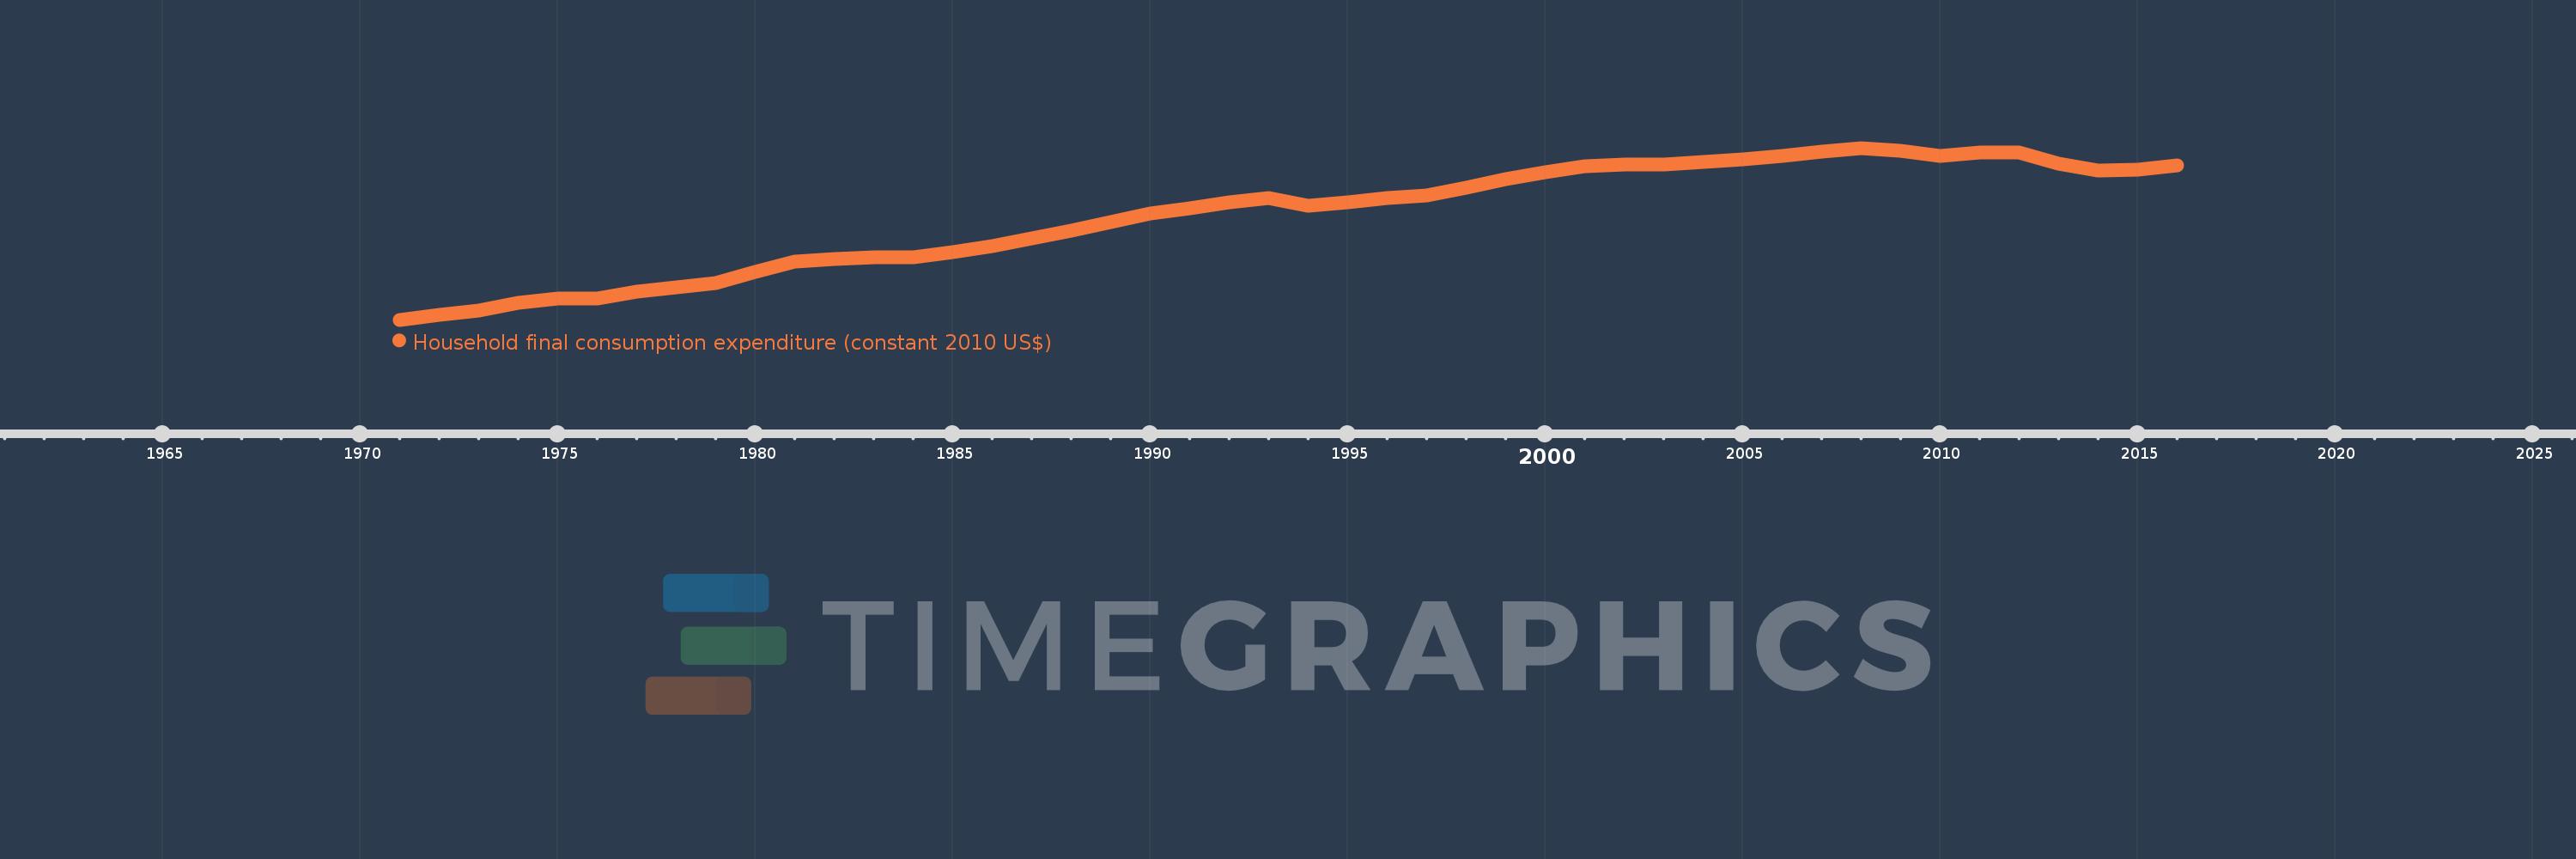
Household final consumption expenditure (constant 2010 US$)
2016,2015,2014,2013,2012,2011,2010,2009,2008,2007,2006,2005,2004,2003,2002,2001,2000,1999,1998,1997,1996,1995,1994,1993,1992,1991,1990,1989,1988,1987,1986,1985,1984,1983,1982,1981,1980,1979,1978,1977,1976,1975,1974,1973,1972,1971
Diese Statistik in anderen Ländern:
AfghanistanAlbaniaAlgeriaAngolaAntigua and BarbudaArab WorldArgentinaArmeniaArubaAustraliaAustriaAzerbaijanBahamas, TheBahrainBangladeshBarbadosBelarusBelgiumBelizeBeninBermudaBhutanBoliviaBosnia and HerzegovinaBotswanaBrazilBrunei DarussalamBulgariaBurkina FasoBurundiCabo VerdeCambodiaCameroonCanadaCaribbean small statesCentral African RepublicCentral Europe and the BalticsChadChileChinaColombiaComorosCongo, Dem. Rep.Congo, Rep.Costa RicaCote d'IvoireCroatiaCubaCyprusCzech RepublicDenmarkDominicaDominican RepublicEarly-demographic dividendEast Asia & PacificEast Asia & Pacific (excluding high income)East Asia & Pacific (IDA & IBRD countries)EcuadorEgypt, Arab Rep.El SalvadorEquatorial GuineaEritreaEstoniaEuro areaEurope & Central AsiaEurope & Central Asia (excluding high income)Europe & Central Asia (IDA & IBRD countries)European UnionFaroe IslandsFinlandFranceGabonGambia, TheGeorgiaGermanyGhanaGreeceGrenadaGuatemalaGuineaGuinea-BissauGuyanaHaitiHeavily indebted poor countries (HIPC)High incomeHondurasHong Kong SAR, ChinaHungaryIBRD onlyIcelandIDA & IBRD totalIDA blendIDA onlyIDA totalIndiaIndonesiaIran, Islamic Rep.IrelandIsraelItalyJamaicaJapanJordanKazakhstanKenyaKorea, Rep.KosovoKuwaitKyrgyz RepublicLao PDRLate-demographic dividendLatin America & Caribbean Latin America & Caribbean (excluding high income)Latin America & the Caribbean (IDA & IBRD countries)LatviaLeast developed countries: UN classificationLebanonLiberiaLithuaniaLow & middle incomeLow incomeLower middle incomeLuxembourgMacao SAR, ChinaMacedonia, FYRMadagascarMalawiMalaysiaMaliMaltaMauritaniaMauritiusMexicoMiddle East & North AfricaMiddle East & North Africa (excluding high income)Middle East & North Africa (IDA & IBRD countries)Middle incomeMoldovaMongoliaMontenegroMoroccoMozambiqueNamibiaNepalNetherlandsNew ZealandNicaraguaNigerNigeriaNorth AmericaNorwayOECD membersOmanOther small statesPakistanPanamaParaguayPeruPhilippinesPolandPortugalPost-demographic dividendPre-demographic dividendPuerto RicoQatarRomaniaRussian FederationRwandaSaudi ArabiaSenegalSerbiaSeychellesSierra LeoneSingaporeSlovak RepublicSloveniaSmall statesSouth AfricaSouth AsiaSouth Asia (IDA & IBRD)South SudanSpainSri LankaSt. Kitts and NevisSt. LuciaSt. Vincent and the GrenadinesSub-Saharan Africa Sub-Saharan Africa (excluding high income)Sub-Saharan Africa (IDA & IBRD countries)SudanSurinameSwazilandSwedenSwitzerlandTajikistanTanzaniaThailandTimor-LesteTogoTongaTrinidad and TobagoTunisiaTurkeyTurkmenistanUgandaUkraineUnited Arab EmiratesUnited KingdomUnited StatesUpper middle incomeUruguayUzbekistanVanuatuVenezuela, RBVietnamWest Bank and GazaWorldYemen, Rep.ZambiaZimbabwe Zeitlinie:
Diese Zeitleiste vorliegt die Graphik ab 1971 J. bis 2016 J. Italy. Die Angaben bis 1970 J. sind nicht vorhanden. Die Zahl aktueller Beobachtungen nach Daten: 46.
Die Quelle (Bezeichnung):
Kennzahlen der Weltentwicklung
Die Quelle (Einrichtung):
World Bank national accounts data, and OECD National Accounts data files.
Kategorien:
Economy & Growth
Es wurde aktualisiert:
23 Apr 2017 Jahr
Kennzahlen der Wertänderungen vom Jahr zum Jahr
im Durchschnitt:
1.015 Trln
Minimum:
552.129 Mlrd.
1 Jan 1971 Jahr
Maximum:
1.316 Trln
1 Jan 2008 Jahr
Zum Datum der Beobachtung
Wert
Absolute Veränderung
Die Veränderung bezüglich dem vorherigen Wert
1 Jan 1971 Jahr
552.129 Mlrd.
+552.129 Mlrd.
0.0%
1 Jan 1972 Jahr
572.986 Mlrd.
+20.857 Mlrd.
3.78%
1 Jan 1973 Jahr
591.951 Mlrd.
+18.965 Mlrd.
3.31%
1 Jan 1974 Jahr
626.25 Mlrd.
+34.299 Mlrd.
5.79%
1 Jan 1975 Jahr
645.955 Mlrd.
+19.704 Mlrd.
3.15%
1 Jan 1976 Jahr
647.954 Mlrd.
+1.999 Mlrd.
0.31%
1 Jan 1977 Jahr
676.999 Mlrd.
+29.045 Mlrd.
4.48%
1 Jan 1978 Jahr
697.183 Mlrd.
+20.184 Mlrd.
2.98%
1 Jan 1979 Jahr
715.469 Mlrd.
+18.287 Mlrd.
2.62%
1 Jan 1980 Jahr
763.833 Mlrd.
+48.363 Mlrd.
6.76%
1 Jan 1981 Jahr
809.598 Mlrd.
+45.765 Mlrd.
5.99%
1 Jan 1982 Jahr
822.618 Mlrd.
+13.02 Mlrd.
1.61%
1 Jan 1983 Jahr
830.658 Mlrd.
+8.04 Mlrd.
0.98%
1 Jan 1984 Jahr
829.168 Mlrd.
-1.489 Mlrd.
-0.18%
1 Jan 1985 Jahr
853.639 Mlrd.
+24.471 Mlrd.
2.95%
1 Jan 1986 Jahr
878.113 Mlrd.
+24.474 Mlrd.
2.87%
1 Jan 1987 Jahr
913.801 Mlrd.
+35.688 Mlrd.
4.06%
1 Jan 1988 Jahr
947.072 Mlrd.
+33.271 Mlrd.
3.64%
1 Jan 1989 Jahr
985.791 Mlrd.
+38.719 Mlrd.
4.09%
1 Jan 1990 Jahr
1.025 Trln
+39.131 Mlrd.
3.97%
1 Jan 1991 Jahr
1.046 Trln
+20.956 Mlrd.
2.04%
1 Jan 1992 Jahr
1.074 Trln
+28.015 Mlrd.
2.68%
1 Jan 1993 Jahr
1.092 Trln
+18.528 Mlrd.
1.73%
1 Jan 1994 Jahr
1.059 Trln
-33.21 Mlrd.
-3.04%
1 Jan 1995 Jahr
1.075 Trln
+16.219 Mlrd.
1.53%
1 Jan 1996 Jahr
1.092 Trln
+16.422 Mlrd.
1.53%
1 Jan 1997 Jahr
1.103 Trln
+11.503 Mlrd.
1.05%
1 Jan 1998 Jahr
1.14 Trln
+36.233 Mlrd.
3.28%
1 Jan 1999 Jahr
1.177 Trln
+37.434 Mlrd.
3.28%
1 Jan 2000 Jahr
1.207 Trln
+29.924 Mlrd.
2.54%
1 Jan 2001 Jahr
1.235 Trln
+28.082 Mlrd.
2.33%
1 Jan 2002 Jahr
1.243 Trln
+7.619 Mlrd.
0.62%
1 Jan 2003 Jahr
1.243 Trln
+455.317 Mln.
0.04%
1 Jan 2004 Jahr
1.253 Trln
+10.273 Mlrd.
0.83%
1 Jan 2005 Jahr
1.266 Trln
+12.345 Mlrd.
0.98%
1 Jan 2006 Jahr
1.282 Trln
+16.353 Mlrd.
1.29%
1 Jan 2007 Jahr
1.301 Trln
+18.58 Mlrd.
1.45%
1 Jan 2008 Jahr
1.316 Trln
+15.101 Mlrd.
1.16%
1 Jan 2009 Jahr
1.302 Trln
-14.229 Mlrd.
-1.08%
1 Jan 2010 Jahr
1.281 Trln
-20.291 Mlrd.
-1.56%
1 Jan 2011 Jahr
1.297 Trln
+15.366 Mlrd.
1.2%
1 Jan 2012 Jahr
1.296 Trln
-154.462 Mln.
-0.01%
1 Jan 2013 Jahr
1.245 Trln
-51.199 Mlrd.
-3.95%
1 Jan 2014 Jahr
1.215 Trln
-30.599 Mlrd.
-2.46%
1 Jan 2015 Jahr
1.22 Trln
+5.337 Mlrd.
0.44%
1 Jan 2016 Jahr
1.238 Trln
+18.427 Mlrd.
1.51%
Bewertung der Länder gemäß mit laufender Statistik nach Jahren


Kommentare: