29
/de/
de
AIzaSyAYiBZKx7MnpbEhh9jyipgxe19OcubqV5w
April 1, 2024
35806
High income
HIC
false
2
1
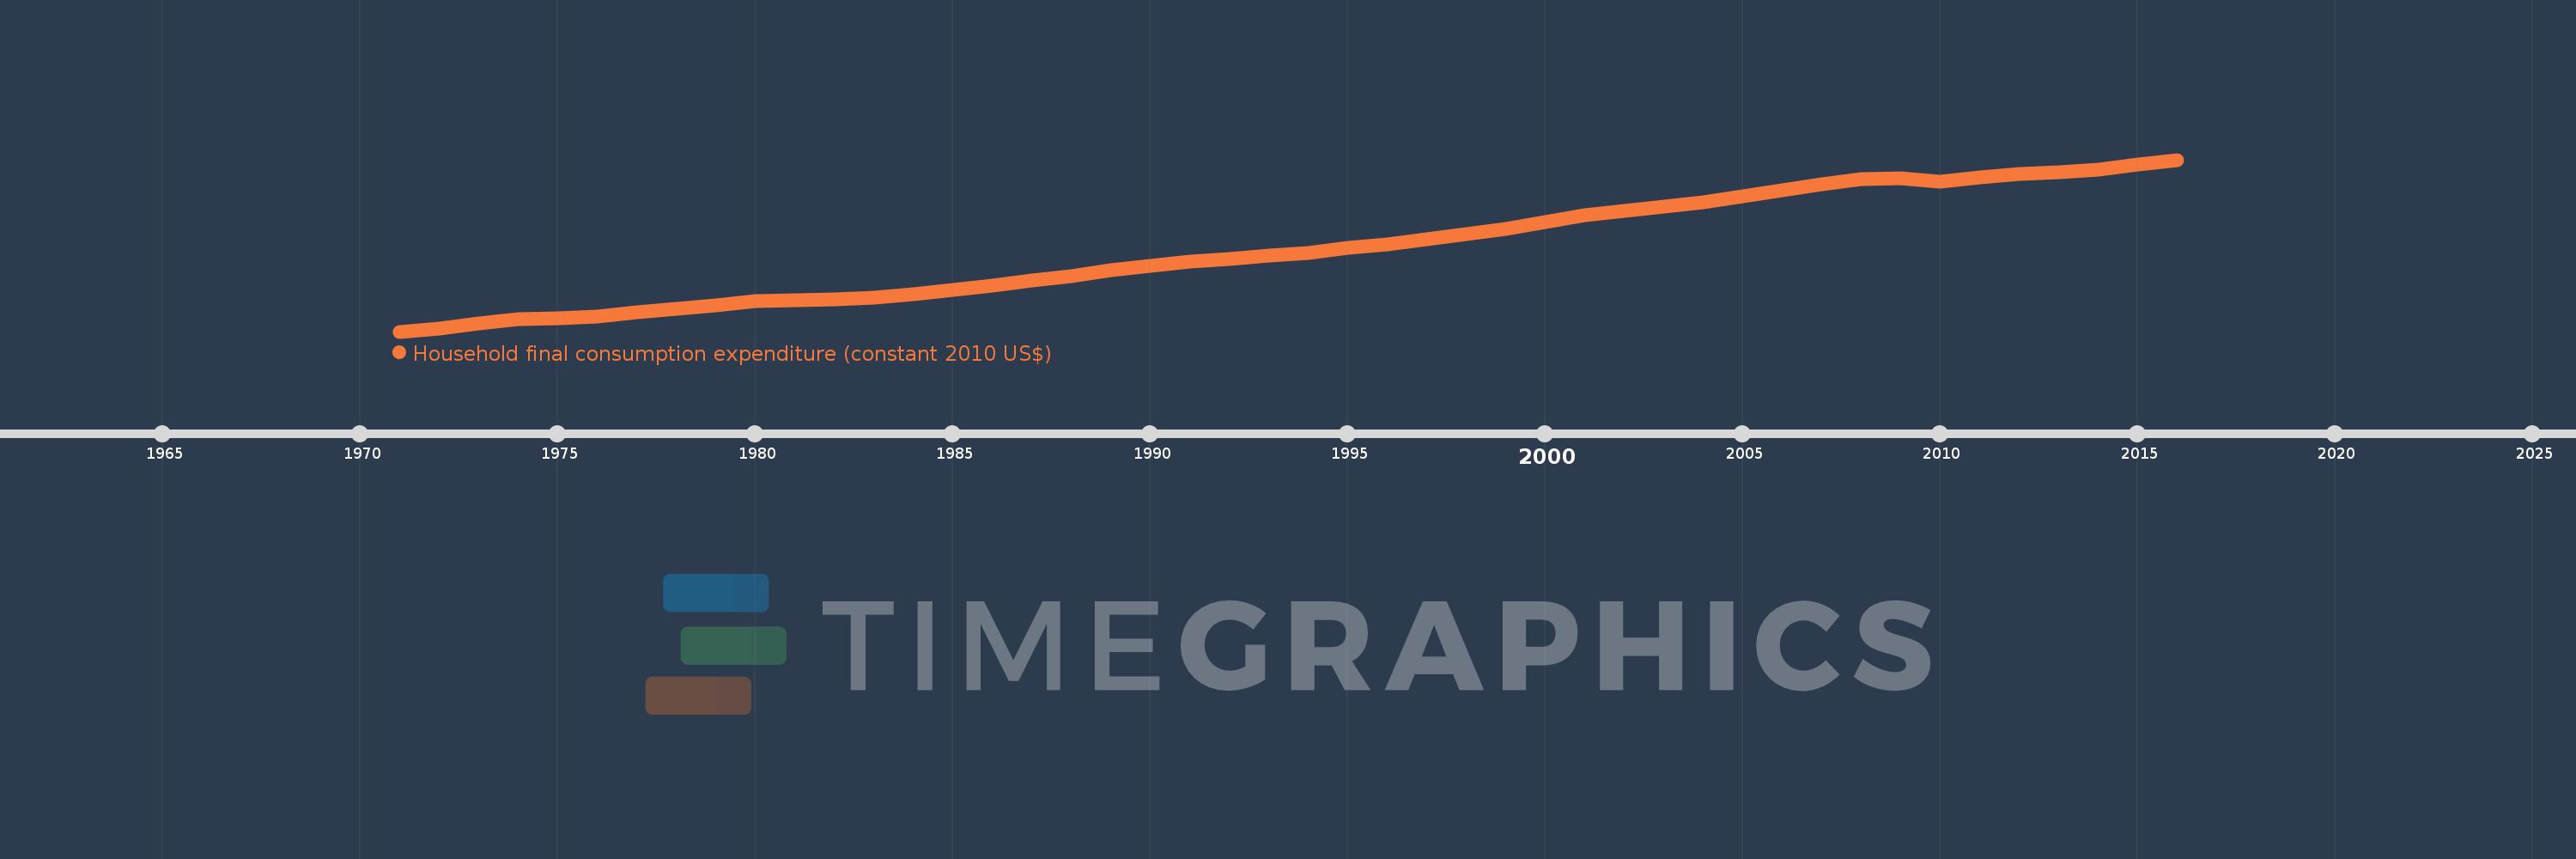
Household final consumption expenditure (constant 2010 US$)
2016,2015,2014,2013,2012,2011,2010,2009,2008,2007,2006,2005,2004,2003,2002,2001,2000,1999,1998,1997,1996,1995,1994,1993,1992,1991,1990,1989,1988,1987,1986,1985,1984,1983,1982,1981,1980,1979,1978,1977,1976,1975,1974,1973,1972,1971
Diese Statistik in anderen Ländern:
AfghanistanAlbaniaAlgeriaAngolaAntigua and BarbudaArab WorldArgentinaArmeniaArubaAustraliaAustriaAzerbaijanBahamas, TheBahrainBangladeshBarbadosBelarusBelgiumBelizeBeninBermudaBhutanBoliviaBosnia and HerzegovinaBotswanaBrazilBrunei DarussalamBulgariaBurkina FasoBurundiCabo VerdeCambodiaCameroonCanadaCaribbean small statesCentral African RepublicCentral Europe and the BalticsChadChileChinaColombiaComorosCongo, Dem. Rep.Congo, Rep.Costa RicaCote d'IvoireCroatiaCubaCyprusCzech RepublicDenmarkDominicaDominican RepublicEarly-demographic dividendEast Asia & PacificEast Asia & Pacific (excluding high income)East Asia & Pacific (IDA & IBRD countries)EcuadorEgypt, Arab Rep.El SalvadorEquatorial GuineaEritreaEstoniaEuro areaEurope & Central AsiaEurope & Central Asia (excluding high income)Europe & Central Asia (IDA & IBRD countries)European UnionFaroe IslandsFinlandFranceGabonGambia, TheGeorgiaGermanyGhanaGreeceGrenadaGuatemalaGuineaGuinea-BissauGuyanaHaitiHeavily indebted poor countries (HIPC)High incomeHondurasHong Kong SAR, ChinaHungaryIBRD onlyIcelandIDA & IBRD totalIDA blendIDA onlyIDA totalIndiaIndonesiaIran, Islamic Rep.IrelandIsraelItalyJamaicaJapanJordanKazakhstanKenyaKorea, Rep.KosovoKuwaitKyrgyz RepublicLao PDRLate-demographic dividendLatin America & Caribbean Latin America & Caribbean (excluding high income)Latin America & the Caribbean (IDA & IBRD countries)LatviaLeast developed countries: UN classificationLebanonLiberiaLithuaniaLow & middle incomeLow incomeLower middle incomeLuxembourgMacao SAR, ChinaMacedonia, FYRMadagascarMalawiMalaysiaMaliMaltaMauritaniaMauritiusMexicoMiddle East & North AfricaMiddle East & North Africa (excluding high income)Middle East & North Africa (IDA & IBRD countries)Middle incomeMoldovaMongoliaMontenegroMoroccoMozambiqueNamibiaNepalNetherlandsNew ZealandNicaraguaNigerNigeriaNorth AmericaNorwayOECD membersOmanOther small statesPakistanPanamaParaguayPeruPhilippinesPolandPortugalPost-demographic dividendPre-demographic dividendPuerto RicoQatarRomaniaRussian FederationRwandaSaudi ArabiaSenegalSerbiaSeychellesSierra LeoneSingaporeSlovak RepublicSloveniaSmall statesSouth AfricaSouth AsiaSouth Asia (IDA & IBRD)South SudanSpainSri LankaSt. Kitts and NevisSt. LuciaSt. Vincent and the GrenadinesSub-Saharan Africa Sub-Saharan Africa (excluding high income)Sub-Saharan Africa (IDA & IBRD countries)SudanSurinameSwazilandSwedenSwitzerlandTajikistanTanzaniaThailandTimor-LesteTogoTongaTrinidad and TobagoTunisiaTurkeyTurkmenistanUgandaUkraineUnited Arab EmiratesUnited KingdomUnited StatesUpper middle incomeUruguayUzbekistanVanuatuVenezuela, RBVietnamWest Bank and GazaWorldYemen, Rep.ZambiaZimbabwe Zeitlinie:
Diese Zeitleiste vorliegt die Graphik ab 1971 J. bis 2016 J. High income. Die Angaben bis 1970 J. sind nicht vorhanden. Die Zahl aktueller Beobachtungen nach Daten: 46.
Die Quelle (Bezeichnung):
Kennzahlen der Weltentwicklung
Die Quelle (Einrichtung):
World Bank national accounts data, and OECD National Accounts data files.
Kategorien:
Economy & Growth
Es wurde aktualisiert:
23 Apr 2017 Jahr
Kennzahlen der Wertänderungen vom Jahr zum Jahr
im Durchschnitt:
18.62 Trln
Minimum:
8.803 Trln
1 Jan 1971 Jahr
Maximum:
29.09 Trln
1 Jan 2016 Jahr
Zum Datum der Beobachtung
Wert
Absolute Veränderung
Die Veränderung bezüglich dem vorherigen Wert
1 Jan 1971 Jahr
8.803 Trln
+8.803 Trln
0.0%
1 Jan 1972 Jahr
9.198 Trln
+394.242 Mlrd.
4.48%
1 Jan 1973 Jahr
9.753 Trln
+555.129 Mlrd.
6.04%
1 Jan 1974 Jahr
10.299 Trln
+545.94 Mlrd.
5.6%
1 Jan 1975 Jahr
10.374 Trln
+75.519 Mlrd.
0.73%
1 Jan 1976 Jahr
10.619 Trln
+245.097 Mlrd.
2.36%
1 Jan 1977 Jahr
11.09 Trln
+470.607 Mlrd.
4.43%
1 Jan 1978 Jahr
11.484 Trln
+393.841 Mlrd.
3.55%
1 Jan 1979 Jahr
11.938 Trln
+454.011 Mlrd.
3.95%
1 Jan 1980 Jahr
12.372 Trln
+434.504 Mlrd.
3.64%
1 Jan 1981 Jahr
12.492 Trln
+119.682 Mlrd.
0.97%
1 Jan 1982 Jahr
12.643 Trln
+151.422 Mlrd.
1.21%
1 Jan 1983 Jahr
12.843 Trln
+199.756 Mlrd.
1.58%
1 Jan 1984 Jahr
13.261 Trln
+417.62 Mlrd.
3.25%
1 Jan 1985 Jahr
13.689 Trln
+428.073 Mlrd.
3.23%
1 Jan 1986 Jahr
14.213 Trln
+524.441 Mlrd.
3.83%
1 Jan 1987 Jahr
14.802 Trln
+588.438 Mlrd.
4.14%
1 Jan 1988 Jahr
15.364 Trln
+561.762 Mlrd.
3.8%
1 Jan 1989 Jahr
16.024 Trln
+660.166 Mlrd.
4.3%
1 Jan 1990 Jahr
16.605 Trln
+581.515 Mlrd.
3.63%
1 Jan 1991 Jahr
17.096 Trln
+490.458 Mlrd.
2.95%
1 Jan 1992 Jahr
17.328 Trln
+232.726 Mlrd.
1.36%
1 Jan 1993 Jahr
17.805 Trln
+476.572 Mlrd.
2.75%
1 Jan 1994 Jahr
18.126 Trln
+320.719 Mlrd.
1.8%
1 Jan 1995 Jahr
18.675 Trln
+549.348 Mlrd.
3.03%
1 Jan 1996 Jahr
19.141 Trln
+466.309 Mlrd.
2.5%
1 Jan 1997 Jahr
19.715 Trln
+573.968 Mlrd.
3.0%
1 Jan 1998 Jahr
20.293 Trln
+577.544 Mlrd.
2.93%
1 Jan 1999 Jahr
20.921 Trln
+628.06 Mlrd.
3.09%
1 Jan 2000 Jahr
21.759 Trln
+837.802 Mlrd.
4.0%
1 Jan 2001 Jahr
22.573 Trln
+814.765 Mlrd.
3.74%
1 Jan 2002 Jahr
23.105 Trln
+531.99 Mlrd.
2.36%
1 Jan 2003 Jahr
23.609 Trln
+503.661 Mlrd.
2.18%
1 Jan 2004 Jahr
24.114 Trln
+504.815 Mlrd.
2.14%
1 Jan 2005 Jahr
24.819 Trln
+705.08 Mlrd.
2.92%
1 Jan 2006 Jahr
25.513 Trln
+694.012 Mlrd.
2.8%
1 Jan 2007 Jahr
26.18 Trln
+667.233 Mlrd.
2.62%
1 Jan 2008 Jahr
26.818 Trln
+638.106 Mlrd.
2.44%
1 Jan 2009 Jahr
26.888 Trln
+69.701 Mlrd.
0.26%
1 Jan 2010 Jahr
26.521 Trln
-367.119 Mlrd.
-1.37%
1 Jan 2011 Jahr
27.03 Trln
+508.975 Mlrd.
1.92%
1 Jan 2012 Jahr
27.397 Trln
+366.909 Mlrd.
1.36%
1 Jan 2013 Jahr
27.662 Trln
+264.992 Mlrd.
0.97%
1 Jan 2014 Jahr
27.962 Trln
+300.029 Mlrd.
1.08%
1 Jan 2015 Jahr
28.49 Trln
+528.022 Mlrd.
1.89%
1 Jan 2016 Jahr
29.09 Trln
+600.255 Mlrd.
2.11%
Bewertung der Länder gemäß mit laufender Statistik nach Jahren


Kommentare: